Explore The Chapters
8. Profitable Chart Patterns Every Trader Needs To Know
9. How To Trade Fibonacci With Price Action
10. How To Trade Trendlines With Price Action
11. How To Trade Moving Averages With Price Action
12. How To Trade Confluence With Price Action
13. Multiple Time Frame Trading
15. Precautions & Conclusion With Price Action Trading
What is a trending market?
It is a market with a strong bias towards one general direction either up or down
- Trending markets are of particular interest to us as swing traders
- If you ride a trend well you can hold the position for an extended time until you get reversal signals
- We have short-term and long-term trends

- Long-term trends can spread over years whereas short-term trends are from a few days to a few weeks
- With proper knowledge of trends, one can take advantage of both long-term and short-term trend movements
- It is important for you to understand the structure of trends so you will not depend on any indicator to tell you if the trend is up or down because understanding what a trend is, the structure of a trend, what signals to look to tell you that a new trend may be starting and the previous one ending is one key knowledge you require as a price action trader.

And you only need to use price action to tell you if a trend is up, down or sideways.

As I’ve mentioned above, there are 3 types of trends. In simple terms, a trend is when price is either moving up, down or sideways.
- So when price is moving up, it’s called an uptrend.
- When price is moving down, it’s called a downtrend.
- When price is moving sideways, it’s called and sideways range
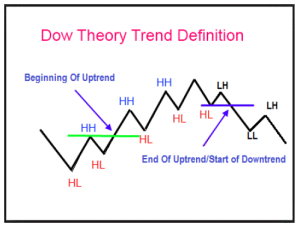
The Dow Theory Of Trends Summarized
The theory in simple terms says that:
- when price is in an uptrend, prices will be making increasing higher highs and higher lows until a higher low gets intercepted, which then signals the end of the uptrend and the beginning of a downtrend.
- For a downtrend, prices will be making increasing lower highs and lower lows until a lower low is intercepted and that signals an end of the downtrend and a beginning of an uptrend.
Structure of An Uptrend (Bull) Market
With an uptrend market, prices will be making higher highs (HH) and Higher Lows (HL), see chart below for clarity:
Structure of A Downtrend (Bear) Market
Prices will be making Lower Highs (LH) and Lower Lows (LL). The chart shown below is a really ideal case, see chart below for clarity:
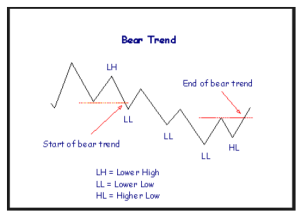
But you know that in reality, the market is not like that, it’s more like this chart shown below:
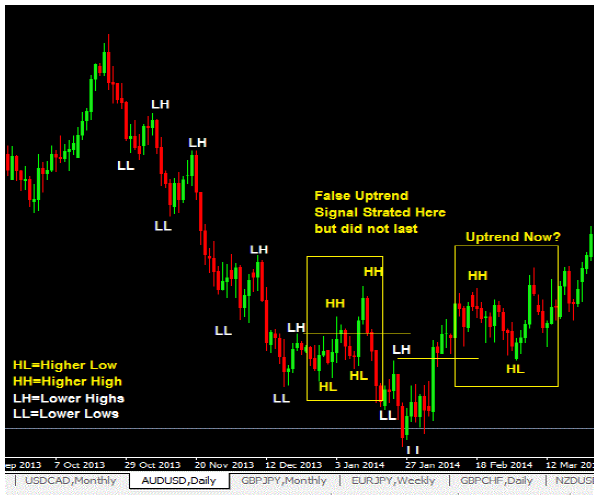
The chart above shows an initial downtrend and along the way, there is a false uptrend which does not last and price moves down and then eventually another uptrend moves is happening because another lower high has been intersected(which signals the end of the downtrend).
This is how you use price action to identify trends.
Because the market is not perfect when these trends are happening, you should develop the skill to judge when a trend is still intact or when a trend is potentially reversing. And it’s pretty much price intersecting highs or lows.

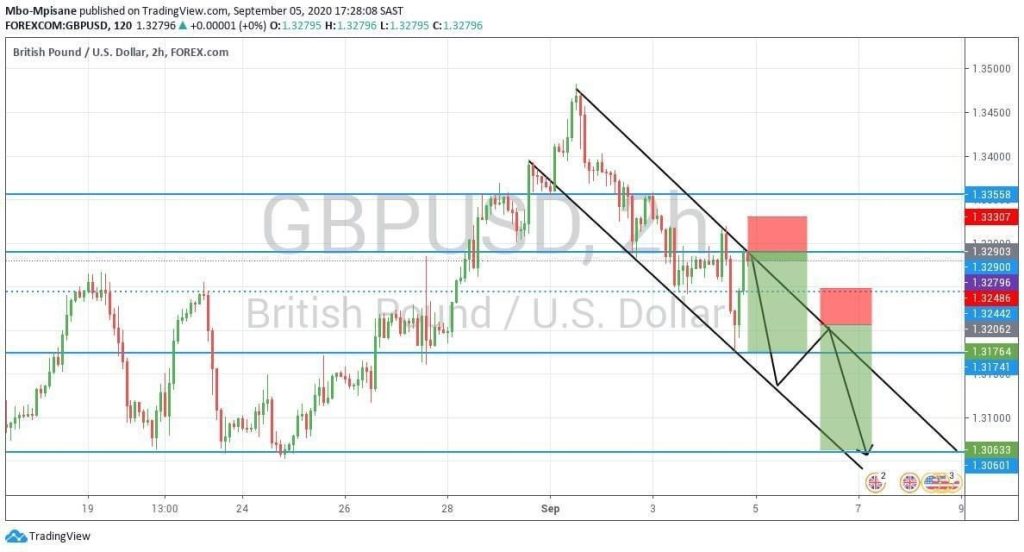
How To Draw Downtrend Trendlines
Now, for a market in a downtrend, you can connect the peaks with a line and that forms you downward trendline.
What you are waiting for is for price to come back up and touch that trendline and when it does, this could mean that a down swing will start and it may be the best time to enter a short trade.
The use of bearish reversal candlesticks as trade confirmation is highly recommended with this trading method.
How To Draw Upward Trendlines
When the market is in an uptrend, connect 2 troughs and you have an upward trendline. When price comes to touch it later, you have a potential buy setup.
The chart below shows a live example of a long trade on AUDNZD pair that I took at the moment whilst I was writing this guide.
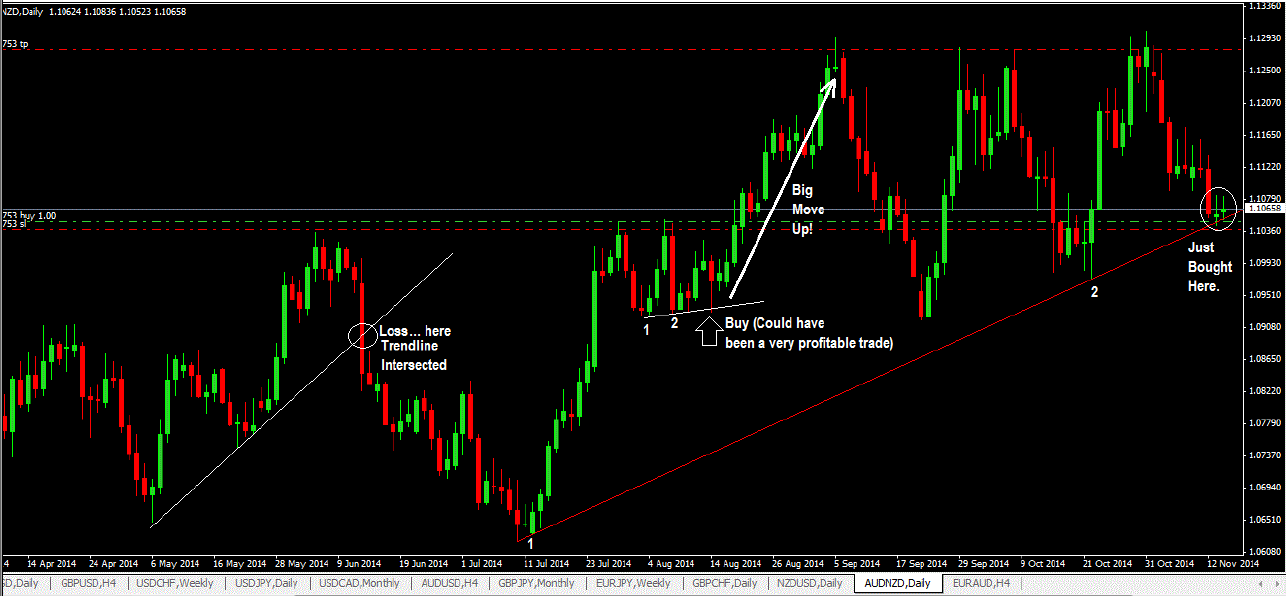
As you can see, I was anticipating a move up to the 1.1290 level and used that as my take profit target level. Obviously, this trade was taken based on the setup in the daily timeframe which means it may be a week or two before the profit target is hit if the market makes a nice move up or the opposite can happen, price breaks the trendline and I get stopped out or I can walk away with some profits when my trailing stop gets hit.
But the next day, price broke that upward trendline and I got stopped out with a loss. But here’s the thing with a trade like that…my stop loss is tight, with a potential reward of more than 3 times what I risked for this trade. Here’s the chart of what happened:
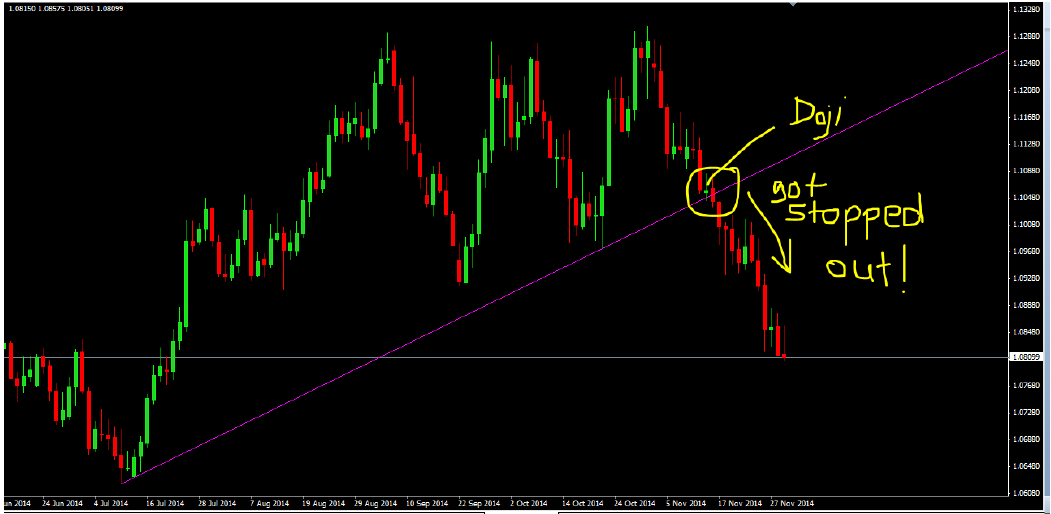
I strongly recommend that you use bullish reversal candlesticks as a signal for executing your buy/long trades.
I’m not glamorizing price action trading here. You will have losses like what I’ve shown.
But think about this…if the price had moved the way I analysed, I would have made a lot more profits than what I lost.
With Price action trading, you are risking less with the potential to make more and that’s the beauty of price action trading.

What happens if the trendline gets intersected?
There are a couple of things you need to be aware of when a trendline gets intersected:
(1)The first is that it could mean the trend has now changed.
(2)The second is that it can be a false break only and price will soon head back in the original direction.
Now, there’s another thing about trendlines, if one trendline gets broken, you need to see if you can draw another trendline above (or below) the one that’s broken. There can be 2 or more downward trendlines or 2 or more upward trendlines at any one time on any chart in any timeframe.
So if price breaks the first trendline, it still has yet to head to the 2nd and the third etc…

So if you take a sell trade on the first trendline but price intersects it and you are stopped out with a loss and now the price is heading to the 2nd trendline above, you should also look to sell if you get bearish reversal candlestick signal.
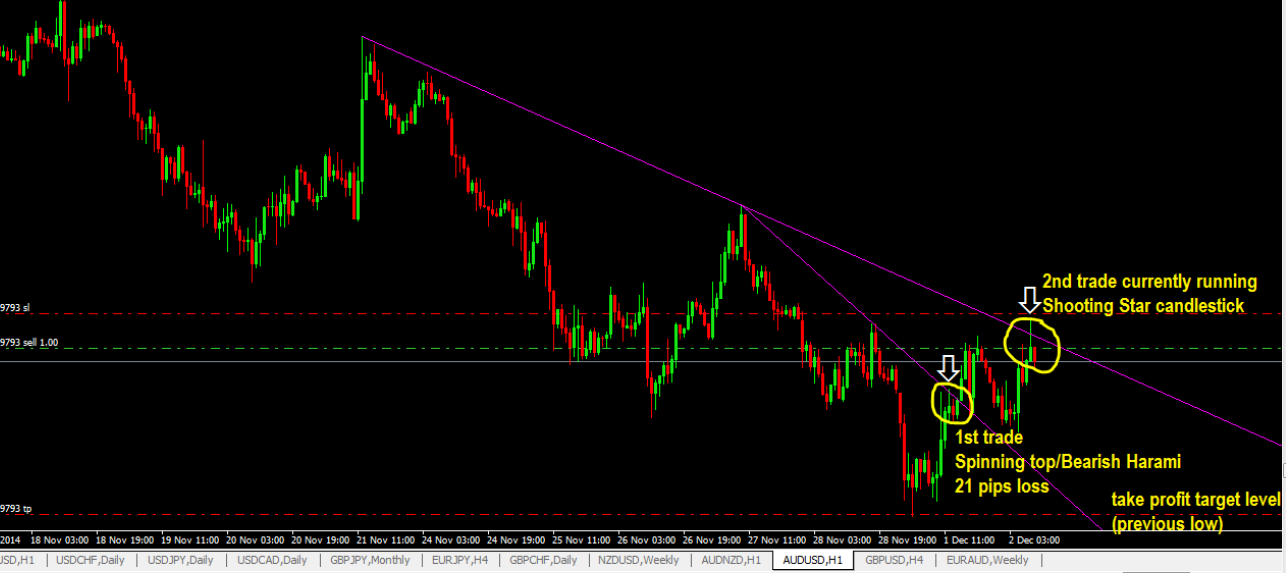
Here’s an example of a trade in a similar situation that I took on the AUDUSD pair. See the chart below: (enlarge if you cannot see it clearly).
You will notice that I took the first trade on the first downward trendline based on a bearish harami and also a spinning top pattern there but then price intersected that trendline and went up to the 2nddownward trendline.
I saw a shooting star so I took another short trade. Obviously, you can see how the price reacted to the trendline by forming a shooting star. That was enough signal for me to short this pair.
You need to be aware of these kinds of trendlines not only on the sell side buy on the buy-side as well.

Trendline Forex Strategies
The following strategies make use of trendlines. They are easy to trade if you have fully grasped what trendlines are.
The 34 EMA Trendline Breakout Forex Strategy
The 34 EMA With Trendline Breakout Forex Trading Strategy combines exponential moving average indicator with price action trading.
In a good trending market, this forex trading strategy is a very reliable trading strategy that can pull in a lot of pips quite easily into your forex trading account.
To prove it, just go and do a bit of backtesting on past price data and you will see what we are talking about after you’ve learnt the trading rules and setups which are explained below.
Timeframes: 5 minutes and above.

Currency Pairs: Any
Forex Indicators: 34 EMA (or you can use other EMA’s like 14, or 21 etc… it's up to you but the concept is the same)
You need a 34 EMA, primarily used only for determining the trend direction of the forex market and an ability to draw good trend lines. Trades are taken after the break on the trendline when price makes a rally or pullback and once this rally or pullback fails, trades are entered.
34 EMA WITH TRENDLINE BREAK FOREX TRADING STRATEGY RULES
Here are the buying and selling rules of this forex strategy.
Buy Rules:
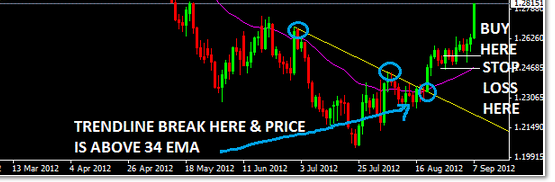
1) draw your downward trendline and see if there is a breakout
(2) if there is a breakout then, the price must then be above the 34 EMA
(3)after the downward trendline breakout, watch the highs of the candlesticks that form.
(4) This is important: The signal candlestick is the candlestick with a high that is lower than the previous candlestick’s high, if that single candlestick’s high is broken, then buy immediately at Market, or you can place a sell-stop order just a few pips above the high of that signal candlestick so if the price breaks its high, your order will be executed.

(5) if your buy-stop order is not executed and the candlesticks continue to make lower highs, move your buy-stop order to each lower high candlestick that forms until price moves up and activates your order.
(6) Place your stop loss just below the low of the candlestick that activates your order.
Sell Rules
Just the exact opposite of Buy Rules:
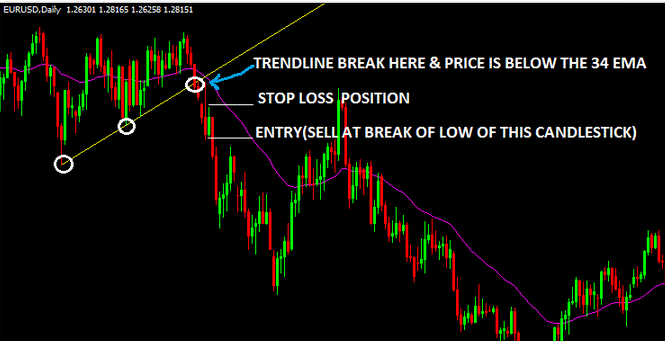
1) draw your upward trendline and wait for a breakout to happen
(2) price must then fall below the 34ema
(3)after the downward trendline breakout, watch the lows of the candlesticks that form.
(4) This is important: The signal candlestick is the candlestick with a low that is higher than the previous candlestick’s low, if that single candlestick’s low is broken, then sell immediately at Market, or you can place a buy-stop order just a few pips below the low of that signal candlestick so if the price breaks its low, your order will be executed.
(5) if your sell stop order is not executed and the candlesticks continue to make higher lows, continue to move your sell stop order to each higher low candlestick that forms until price moves down and activates your sell stop order.
(6) Place your stop loss just above the high of the candlestick that activates your order.

Setting Profit Targets With The 34 EMA Trendline Breakout Forex Strategy
Here are a couple of options for placing profit targets:
(1) Take profit at the level when profit is 3 times what you risked initially.
(2) If trading from a daily chart, place a profit target of 80-250 pips
(3) If trading from the 4hr chart, aim for 40-120 pips profit targets.
(4) You can also use previous swing high points (peaks) as profit target levels for buy orders and previous swing low points(troughs) as profit target levels for sell orders.
Trade Management While Using The 34 EMA Trendline Breakout Forex Strategy
Learn to lock in your profits by moving your stop loss i.e setting a positive stop loss.
- If you are trading off from the daily chart, you can move your stop loss and place a few pips behind each daily candlestick’s low if it's a buy trade or if it's a sell trade, place the stop loss behind the high.
The same can be done if you are trading off from the 4hr timeframe.

- One of the best ways of managing a trade is to trail-stop your trades just behind or above each successive price swing as your trade continues to move in your desired direction.
These price swing points are essentially support and resistance levels and placing your trailing stop above or below such levels ensures that you do not get stopped out prematurely. With practice, you can ride out the trend for a very long time if the trend is strong.

ADVANTAGES OF THE 34 EMA WITH TRENDLINE BREAK FOREX TRADING STRATEGY
- allows you to trade with the trend
- use of price action and trend lines to enter your trades
- when price breaks a trendline, it is often a good signal that that trend is now changing and added onto that the 34 EMA gives you the direction of the market too, so when you enter a trade with this system, it allows you to almost get into a trade at the start of a new trend.

DISADVANTAGES OF THE 34 EMA WITH TRENDLINE BREAK FOREX TRADING STRATEGY
- there will be times when you will see there won't be enough swing points (peaks & troughs) to draw your trend lines from and these often happen when the market makes a massive move without slowing down from those peaks and troughs.
- There is a tendency to get false signals in a ranging or sideways market
ADDITIONAL TRADE ENTRY TECHNIQUES
Learn to use bullish reversal candlesticks on buy trading setups and bearish reversal candlesticks on sell trading setups. This greatly would enhance and really refine your trade entry.
Other Posts You May Be Interested In
Profitable Chart Patterns Every Trader Needs To Know
There’s a difference between chart patterns and candlestick patterns. Chart patterns are not candlestick patterns and candlestick patterns are not chart patterns: Chart [...]
Bullish Engulfing Pattern Forex Trading Strategy
One important skill as a forex trader is the ability to spot reversal patterns when [...]
Multiple Time Frame Trading
What is Multi-timeframe Analysis Multiple time frame trading is the process of analysing the same [...]
How To Make Money Without Trading As Deriv Affiliate Partner
Do you know you can earn up to 45% lifetime commission on Deriv without placing any [...]
HFM Broker Review (2024) ☑️ Is It Trsutworthy?
HFM Overview HFM, previously known as Hotforex was founded in 2010 and has its headquarters [...]
Day Trading
What Is Day Trading? This is the definition of day trading in the context of [...]