
Explore The Chapters In The Price Action Course
Share this using the buttons below
What is Multi-timeframe Analysis
Multiple time frame trading is the process of analysing the same currency pair under different time frames eg 30 min, 1 hr, 4 hr and daily charts. The larger time frame is used to establish a longer-term, dominant trend, while a shorter time frame is used to spot ideal entries into the market to catch trades early.
Advantages of Multi-timeframe trading
- You get better trade entries as explained below
- You get a smaller stop loss distance so there is a better risk: reward ratio which means you can increase the number of trades you trade without risking more of your trading account…so if your trade direction is right, you make a lot more money!

How To Get Better Trade Entries And So Reduce Your Stop Loss Distance With Multi Timeframe Analysis And Trading
If you are trading strictly using large timeframes like the daily chart, your stop loss distance will be huge and the issue with that is your risk: reward ratio can be reduced (not necessarily all the time):
What is The Risk to Reward Ratio In Forex Trading?
The risk-reward ratio measures how much your potential reward is, for every dollar you risk.
For example:
- If you have a risk-reward ratio of 1:3, it means you’re risking $1 to potentially make $3.
- If you have a risk-reward ratio of 1:5, it means you’re risking $1 to potentially make $5.
Simply put, investing money into the investment markets has a high degree of risk, and if you’re going to take the risk, the amount of money you stand to gain needs to be big.
Let’s study a chart of what happened in the past to make you understand risk: reward ratio in trading.
The chart below is a daily chart and shows a triple-top pattern in a solid resistance level. Price has been pushed down twice from this level and when the third time it price reaches this level, it was pushed down again.
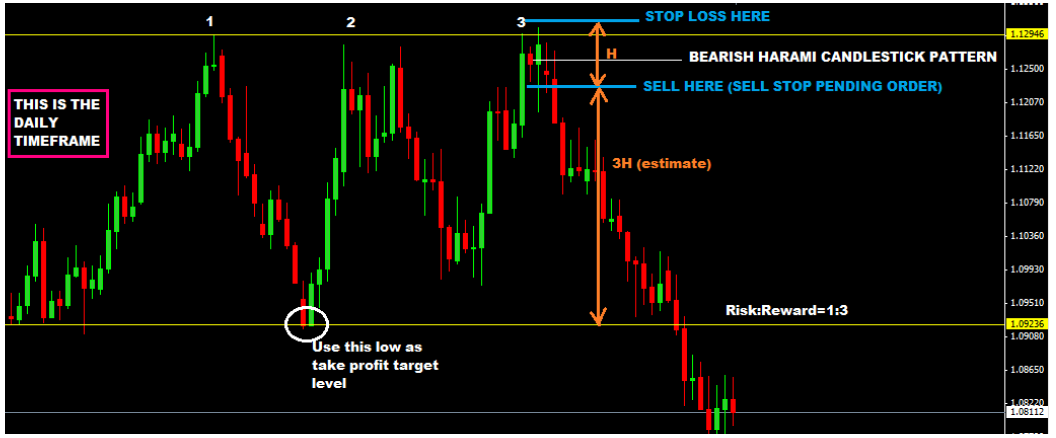
Now, you can see the bearish harami reversal candlestick pattern and you could have used this as your sell signal by placing a pending sell stop order just a few pips under the low and placing your stop loss outside of the resistance line as shown on the chart above.
But if you switched to the 1hr chart to wait for trade entry, your stop loss distances would be very small in comparison to the daily timeframe as shown by the chart below(I’ve zoomed in to get in closer):
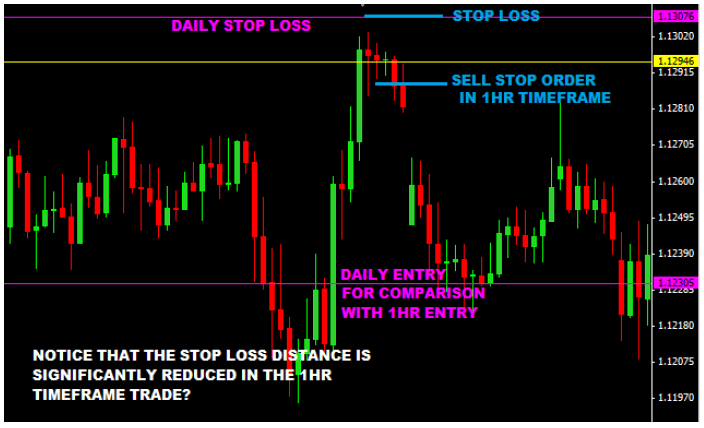
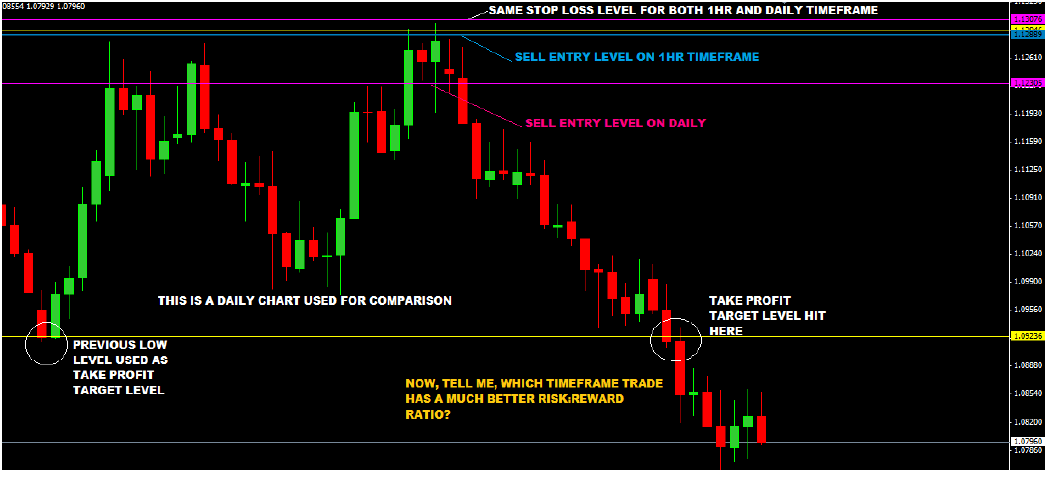
Now, let’s compare both trades in the daily chart:

Multiple Time Frame Trading Reduces Stop Loss Distance
Notice that the 1hr trade entry, was done almost at the very top and the stop loss distance was very small in comparison to the trade taken in the daily timeframe. This means that the risk: reward of the 1hr timeframe trade is a lot better than what you would get in the daily.
Now, you can do this with daily timeframe and 4hrs or even down to the 30 and 15-minute timeframes. Or you can watch trade setups in the 4hr but switch to either the 1hr, 30mins, 15min and 5mins for your trade entries.

We often use the 1hr for my trade entries and can even go down to a 5min timeframe for my entries. If you are a new trader, stick to 1hr or 4hr timeframe for your trade entries.
So when you trade in the 1hr timeframe (or a much smaller timeframe) you can actually trade a lot more contracts without risking more because your stop loss distance are very small compared to the larger timeframe trade.
For example, the stop loss for the 1hr timeframe trade is 20 pips but for the daily timeframe trade is 80 pips. Let’s say that you have a $10,000 account and you risk 2%($200) each trade.
If you trade in the daily chart, that stop loss of 80 pips is roughly $800 so to keep your risk at 2% the number of contracts you will trade will be 0.25.

However, if you’ve traded in the 1hr you can be able to trade 1 standard lot.
This simple example explains why we wait patiently for trade setups to happen in the monthly, weekly, daily, 4hr timeframes and then use smaller timeframes to get good trade entries. This is the beauty of multi-timeframe trading using price action.
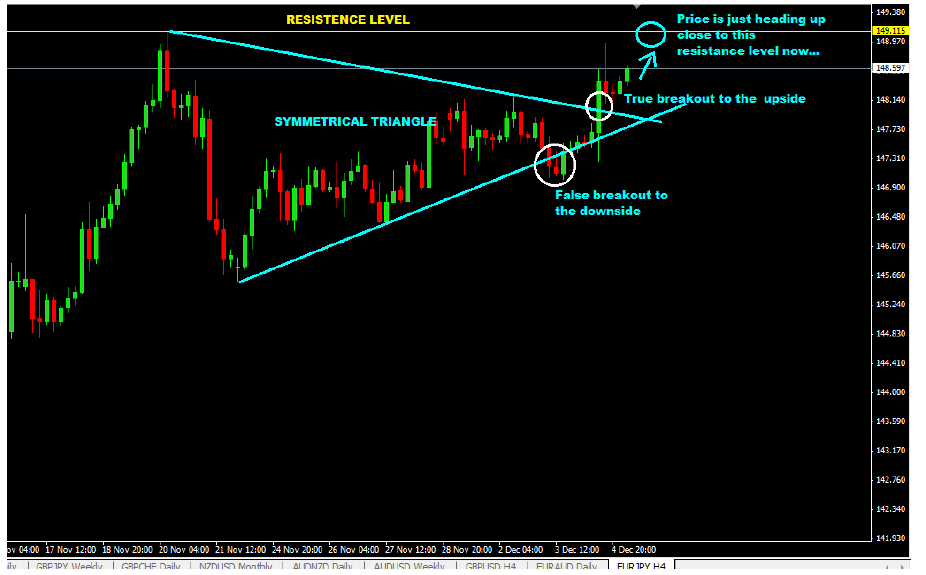
Let us give one more example of multi-timeframe analysis…You can see that EURJPY has been on an uptrend on the monthly charts and I can also see that there is resistance level at 149.115 which it hit already.
This is the monthly chart:
Now, lets zoom in on the daily chart and see what the price action is like on where the arrow is pointing (see chart below):

Ok, you begin to see what’s happening…so obviously, EURJPY has been rejected down on the 149.115 resistance level with the formation of the shooting star (bearish candlestick signal) but now, I can see that its going back up to test that level again.
Two things can happen here:
- Price is going to hit the resistance level and head back down ( and we will be waiting for a bearish reversal candlestick there to sell when I see one).
- Or it's going to break it and if it breaks it, there’s a significant resistance level above it you can see on the monthly chart.
Now, let’s go down into the 4hr chart to see what is happening there as well…

Multi Time Frame Trading Uncovers Trading Opportunities Hidden in Smaller Timeframes
So now you can see how we do our multi-timeframe analysis to get down a timeframe where I execute a trade at a very good price level or entry point whilst keeping my stop loss distance tight.
Now, here’ ‘s the thing about larger timeframes:
“They cover up trading setups that are happening in smaller timeframes that could be really reliable trading setups.”

But when you switch back and forth between timeframes, you begin to see how you can trade the larger timeframes setups based on the setups that happen in the smaller timeframes. This will help you become a better price action trader.
You can also use multi time frame trading in cryptocurrency, stock and synthetic indices trading.
Explore The Chapters In The Price Action Course
Share this using the buttons below
Other Posts You May Be Interested In
The Best Forex Demo Contests (Updated 2024)
Below is a list of the best and current forex demo account contests. Broker [...]
Iq Option Broker Review
Iq option was originally founded as a binary options broker in 2013. The broker has [...]
Gartley Pattern Forex Trading Strategy
This strategy is based on a pattern called the Gartley pattern. You will need the [...]
Pin Bar Forex Trading Strategy
The Pin Bar Forex Trading Strategy is a great trading strategy for trend trading: If [...]
How To Trade Trendlines With Price Action
What is a trending market? It is a market with a strong bias towards one [...]
How To Trade Flags & Pennants
Flags and pennants are popular continuation patterns that every trader must know. Flags and pennants [...]