Explore The Chapters
8. Profitable Chart Patterns Every Trader Needs To Know
9. How To Trade Fibonacci With Price Action
10. How To Trade Trendlines With Price Action
11. How To Trade Moving Averages With Price Action
12. How To Trade Confluence With Price Action
13. Multiple Time Frame Trading
15. Precautions & Conclusion With Price Action Trading
There’s a difference between chart patterns and candlestick patterns. Chart patterns are not candlestick patterns and candlestick patterns are not chart patterns:
- Chart patterns are geometric shapes found in the price data that can help a trader understand the price action, as well as make predictions about where the price is likely to go.
Candlestick patterns, on the other hand, can involve only one single candlestick or a group of candlesticks which have formed one after the other in regard to how they form in relation to one another in terms of their body length, opening and closing prices, wicks(or shadows) etc.
Not knowing what chart patterns are forming can be a costly mistake.
Because you are completely unaware of what is forming on the charts and you end up taking a forex trade that is not in line with what the chart pattern is signalling or telling you!
Now let's look at these chart patterns in detail.
Triangle Chart Patterns -Symmetrical, Ascending & Descending
Triangle Chart Patterns are very profitable & trade setups.The ability to recognise and trade them is indispensable for a price action trader.
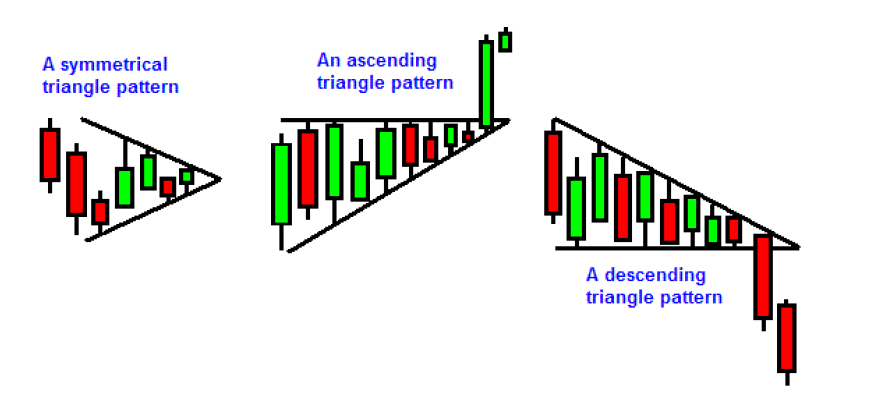
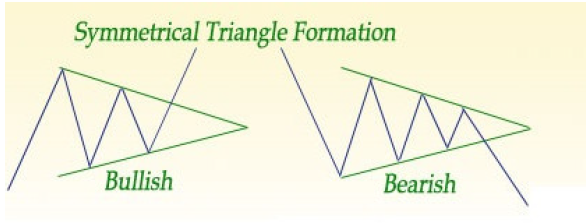
There are 3 types of triangle chart patterns and the chart below shows the differences between each very clearly:
:
Is A Symmetrical Triangle a Bullish Or Bearish Chart Pattern?
The Symmetrical triangle chart pattern is a continuation pattern, therefore, it can be both a bullish or bearish pattern.
This means that if you see it in an uptrend expect a break to the upside and vice versa as shown.
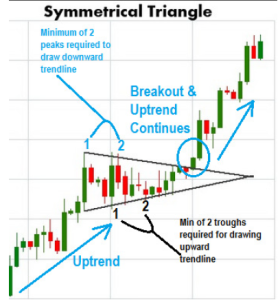
Symmetrical triangle breaking to the upside (bullish symmetrical triangle)
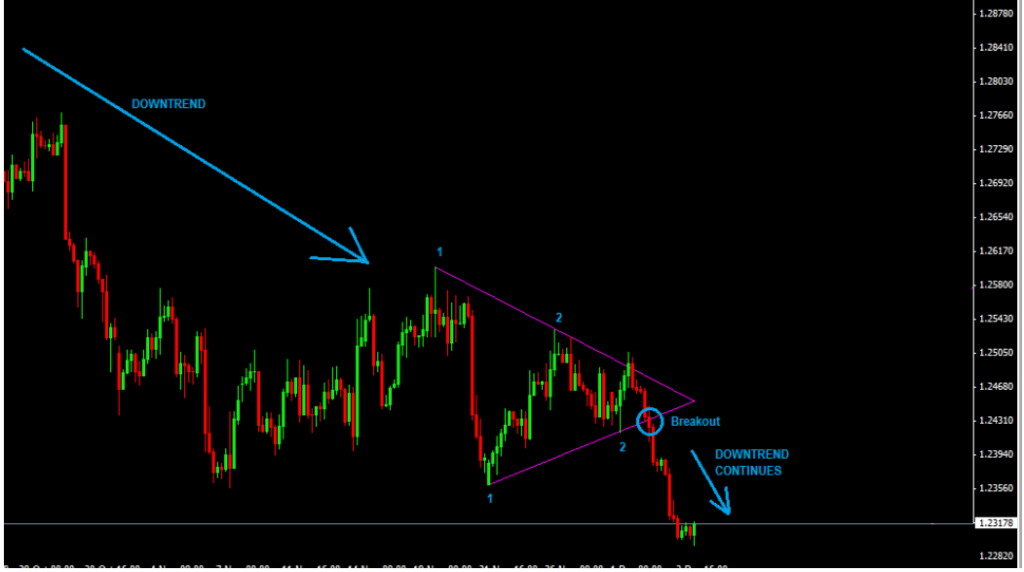
How To Draw A Symmetrical Triangle
You will see price moving up and down but this up-and-down movement is converging to a single point.
You need a minimum of 2 peaks and 2 troughs to draw the two trendlines on both sides. It will be only a matter of time before price breaks out of the pattern and either moves up or down
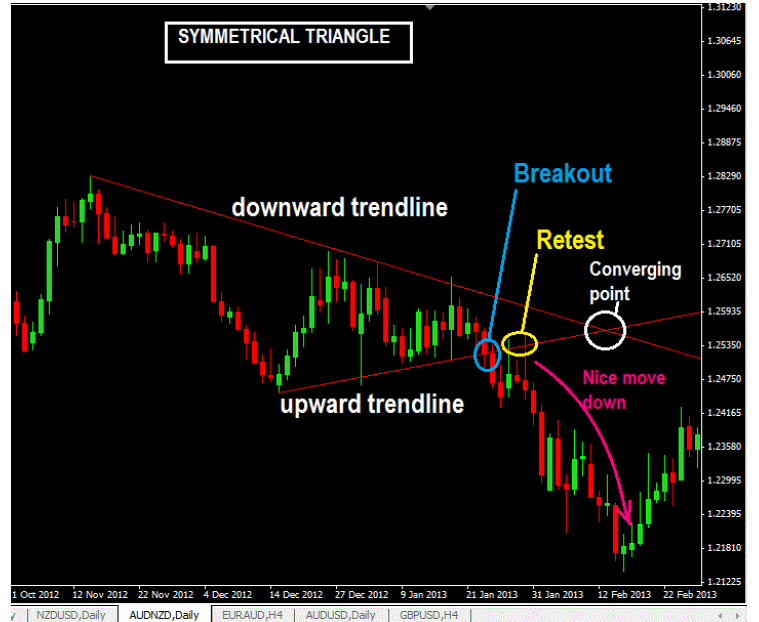
Two Ways To Trade The Symmetrical Triangle
#1: Trade the Initial Breakout
The best way is to confirm that the breakout actually happens with a candlestick before placing your order. What I do I is for example, say I’m watching a symmetrical triangle form in the 4hr charts and I know that soon a breakout will happen.
I then switch to the 1hr chart to wait for the breakout to happen. If a 1hr candlestick has broken the triangle and closed below/above it, that’s my trade entry signal. So I will place a pending buy stop/sell stop order to catch the breakout from there. this is multi-timeframe trading.
Often I want to make sure that the 1hr candlestick closes outside of the triangle before I enter a pending buy stop or sell stop order to capture the move that happens to avoid false breakouts while the candlestick has not closed yet.
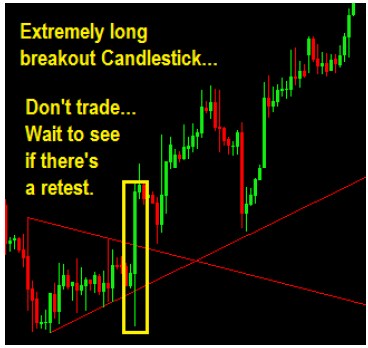
But here’s the problem with trading triangle breakouts, see the chart below:
I don’t like trading breakouts like the one shown here and here’s why:
The stop-loss distance is too large. I’d prefer to enter trades with breakout candlesticks that are close to the trend lines that have been broken.
I often see that such breakout of extremely long candlesticks are not sustainable and price will often tend to reverse after such candlesticks as can be seen by the chart above…notice that after the breakout candlestick, there was one bearish green pin bar and then for the next 4 candlesticks afterwards, the price went down.
This is what tends to happen with such long breakout candlesticks. So if you entered a buy order using that long breakout candlestick above, you would have to wait a while for your trade to turn profitable.
2: Trade the retest of the trendline that is broken
The second way to enter is to wait for a retest of the broken trendline in the triangle pattern then either buy or sell.
This may also be handy if you had an extremely long breakout candlestick on the initial breakout, your best option is to wait for a retest of the breakout trendline then if that happens you enter. See an example of the AUDNDZ Daily chart fig 1 above.
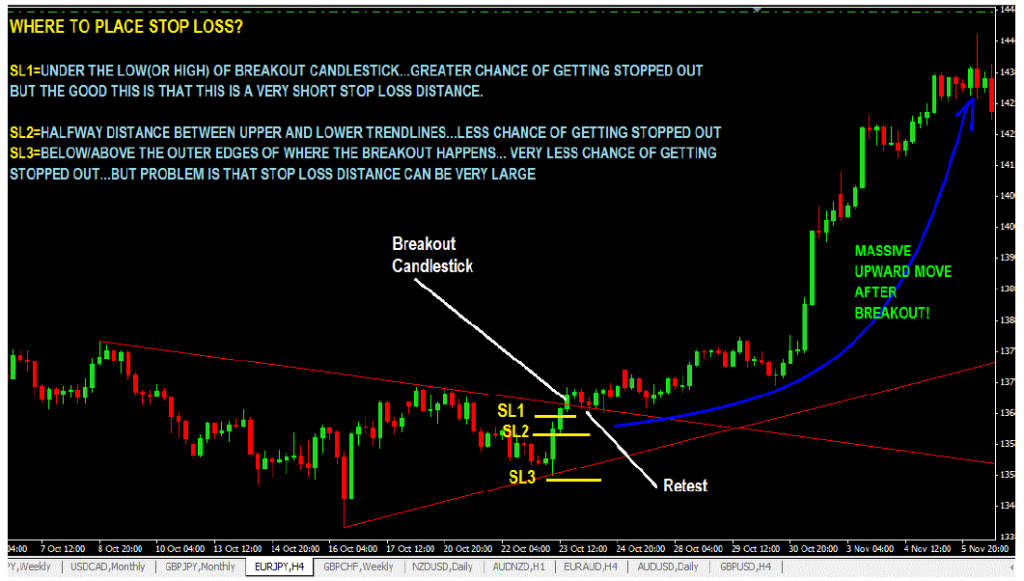
Stop loss Placement Options On Symmetrical Triangle Chart Patterns
Here are 3 ways on how to place a stop loss on triangle patterns, which include symmetrical, ascending and descending triangle patterns which you will learn next. The stop loss placement techniques here are applicable to all triangle patterns so take note of that:
-
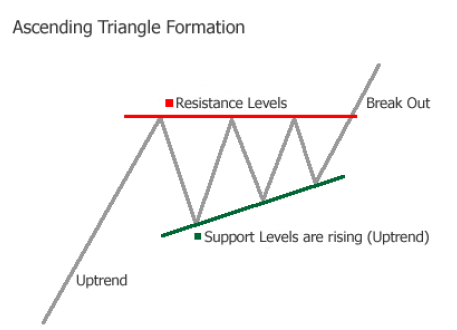
Ascending Triangle Chart Patterns
And ascending triangle pattern looks like this chart shown below:
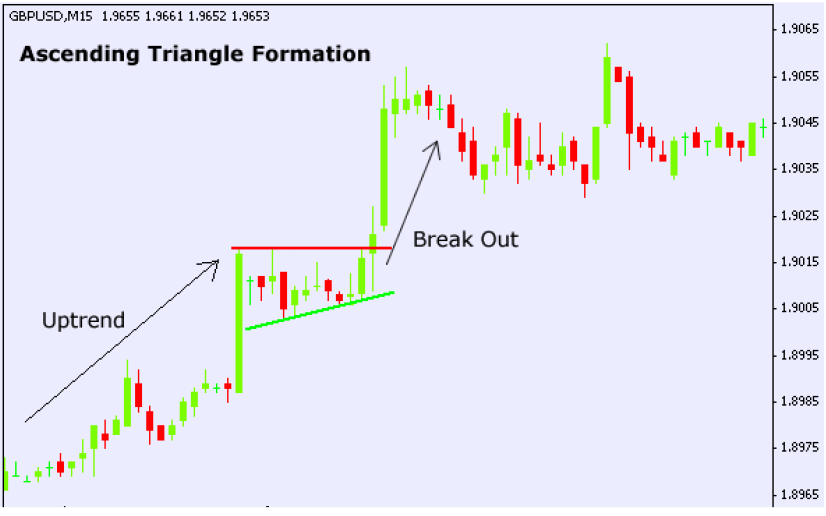
And this is how a real chart looks like:
is Ascending Triangle Chart Pattern Bullish Or Bearish?
It is considered a bullish continuation pattern in an existing uptrend. So when you see this forming in an uptrend, expect a breakout to the upside.
However, it can also be a strong reversal signal (bullish) when you see it form in a downtrend.
Stop Loss Placement Options
You can use the strategies given in the symmetrical triangle example above.
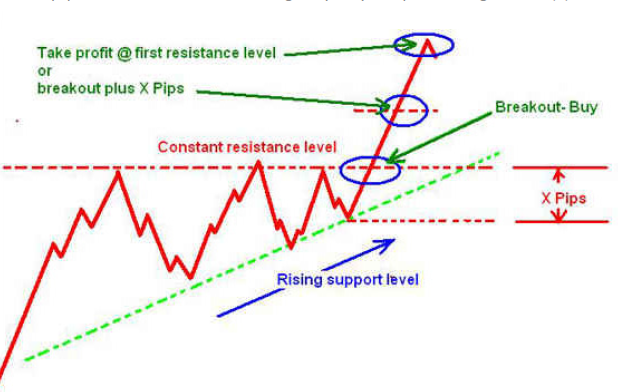
Take Profit Options
I prefer to target previous resistance levels as my take-profit target.
Or as shown on the chart below, you can use the “x” pips distance as your take profit target. Another way to do it would be say 3 times the “x” pips or 2 times the “x pips” distance.
That should give you your profit target level(s).
-
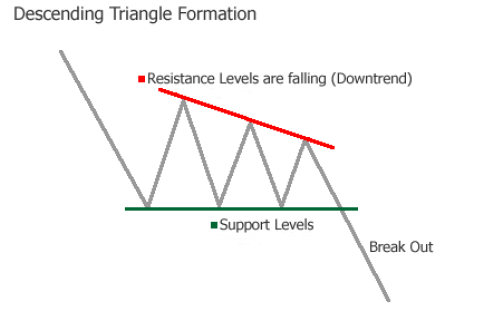
Descending Triangle Chart Patterns
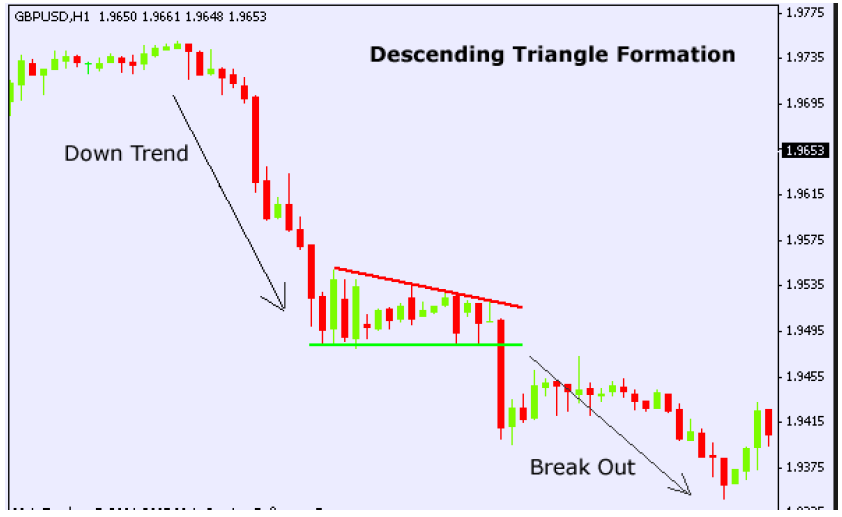
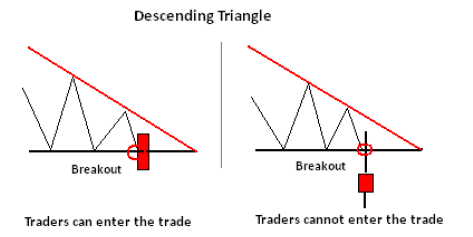
Important things to note about the descending triangle chart pattern: The descending triangle chart pattern is characterized by descending resistance levels and a fairly horizontal support levels converging to a point until a breakout happens to the downside as shown below:
And this is how a descending triangle looks like on a chart
Is Descending Triangle Chart Pattern Bullish Or Bearish?
It is a bearish chart pattern that forms in a downtrend as a continuation pattern. However, this pattern can also form as a bearish reversal pattern at the end of an uptrend.
Therefore regardless of where it forms, it’s a bearish chart pattern.
How to Trade The Descending Triangle Chart Patterns
Similar to the other 2 triangle patterns, you can either trade the initial breakout or wait to see if price reverses back to test the broken support level and then sell.
Note: with a triangular pattern, I often prefer to wait for a candlestick to break out and close outside of the pattern before I enter a trade. This helps to reduce false breakout signals.
But there will be times when I will just trade the breakout with a pending sell stop order just a few pips under the support level to catch the breakout when it happens but when I do that, I sit and watch the close of the 1hr candlestick to make sure that it does not close above the support line (if that happens, it may mean a false breakout).
And then there are the issues of extremely long breakout candlesticks again like this:
As mentioned previously when you have such extremely long breakout candlesticks like that, better to sit and wait to see if the price will reverse and get back up to the support level that was broken ( a retest) which will now be acting as a resistance level and then sell when that level is touched.
How To Take Profit When Trading The Descending Triangle Formation
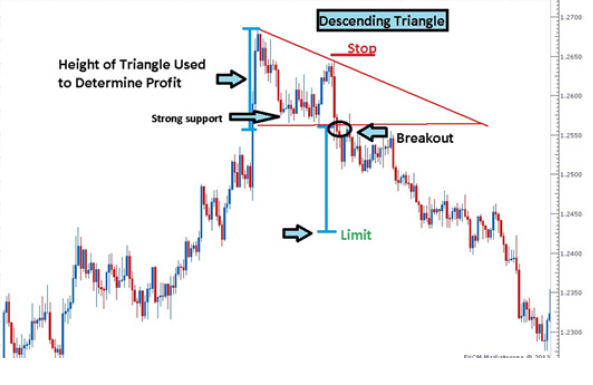
I prefer to use previous support levels, lows or troughs and use those as my take profit target level.
Another method of taking profit that is commonly used is to measure the height of the triangle and if the height is said 100 pips then that is your take profit target. The chart here should give you a clear idea of how it’s done.
Head & Shoulders Chart Patterns
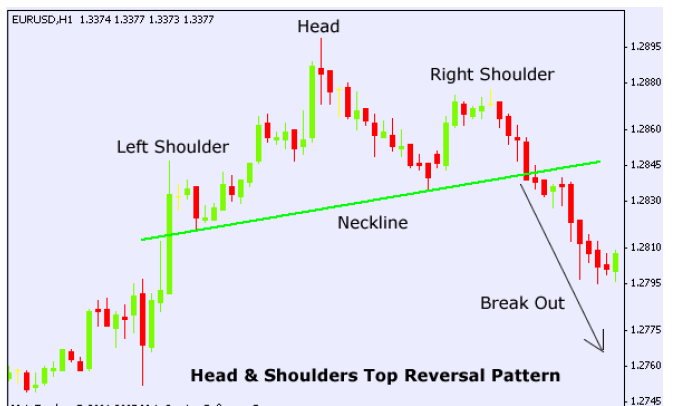
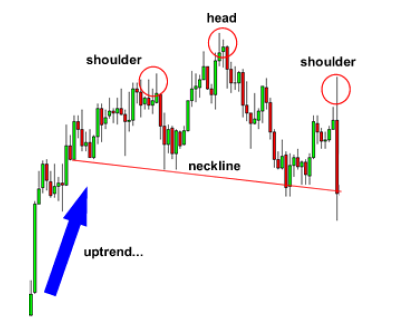
The head and shoulder chart pattern is a bearish reversal chart pattern. This is what a head and shoulder reversal pattern looks like:
Important things to note about the head and shoulder pattern:
The head and shoulders pattern is a bearish reversal pattern and when found in an uptrend, it signals the end of the uptrend.
Here’s how this pattern forms:
- Eventually, the market begins to slow down after going up for some time and the forces of supply and demand are generally considered in balance.
- Sellers come in at the highs (left shoulder) and the downside is probed (beginning neckline.)
- Buyers soon return to the market and ultimately push through to new highs (head.)
- However, the new highs are quickly turned back and the downside is tested again (continuing neckline.)
- Tentative buying re-emerges and the market rallies once more, but fails to take out the previous high. (This last top is considered the right shoulder.) Buying dries up and the market tests the downside yet again.
- Your trendline for this pattern should be drawn from the beginning neckline to the continuing neckline.
Here is another example
Another example below:
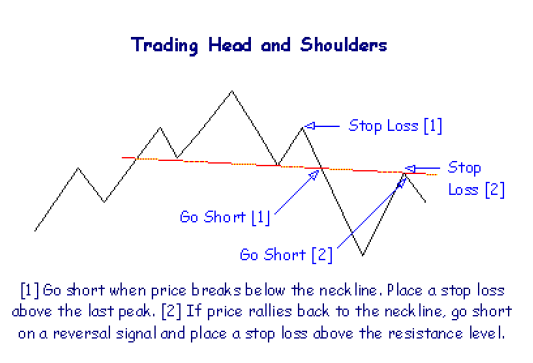
How To Trade The Head & Shoulders Chart Patterns
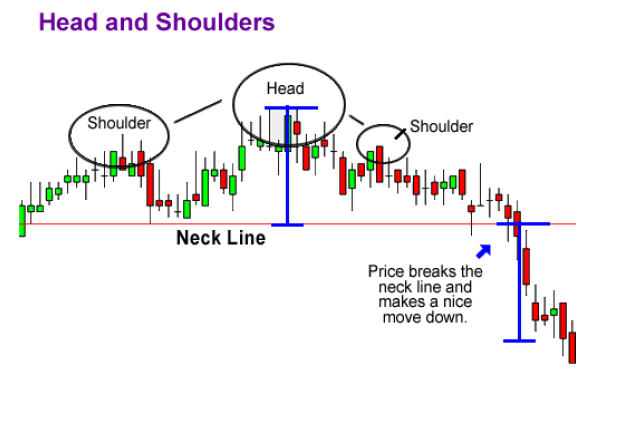
How To Calculate Profit Targets for head and shoulders chart patterns
You can use previous lows or troughs to set your take-profit target.
You can also use the distance in pips between the neckline and the head as your take profit target level. So if the distance is 100 pips, then if you trade the initial breakout, you set it at 100pips take profit target level like the chart shown below with the two blue lines:
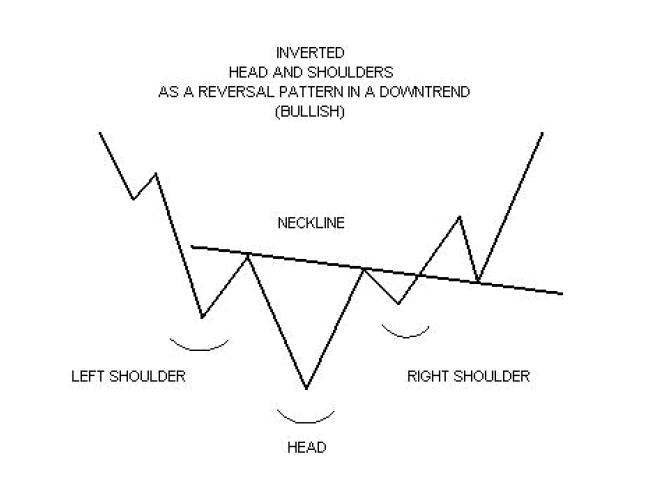
Inverse Head and Shoulder Chart Patterns
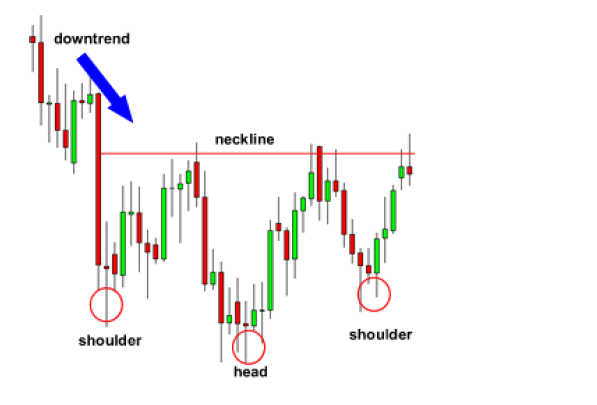
The inverse head and shoulder pattern is a bullish reversal candlestick pattern and is just the opposite of the head and shoulders pattern. Here’s what it looks like on the chart shown below:
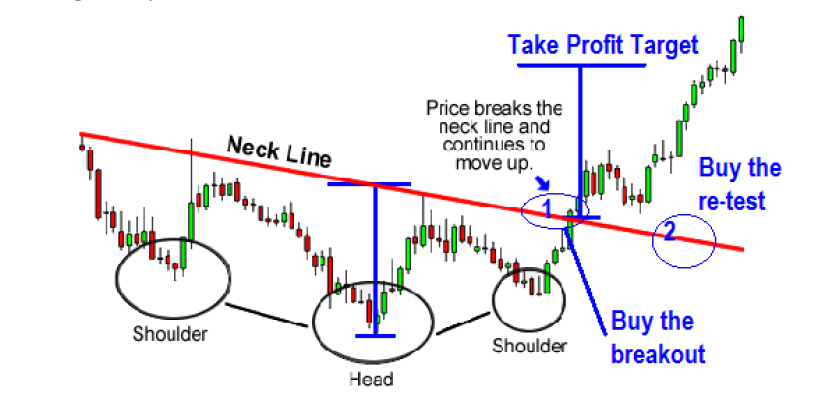
And this is what it looks like on a real chart:
How to Trade the Inverse Head and Shoulder Chart Patterns
You can buy the initial breakout of the neckline or wait for the re-test, that is waiting for the price to break out and then come back down to test the broken neckline and then buy.
Use bullish reversal candlesticks for trade entry confirmation if you are waiting to buy on re-test.
You can use the same take-profit strategies as the ones for the normal head and shoulders pattern above.
Double Bottom Chart Patterns
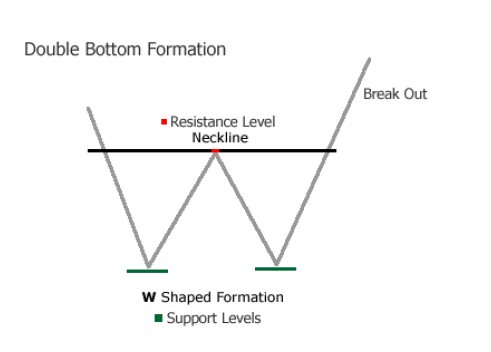
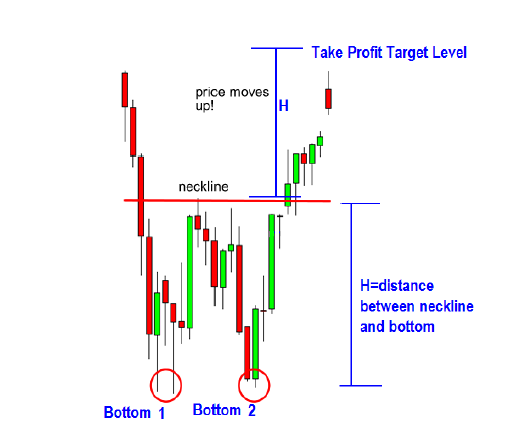
A double bottom chart pattern is a bullish reversal chart pattern and when it forms in an existing downtrend, it signals a possible upward trend.
Here’s what It looks like:
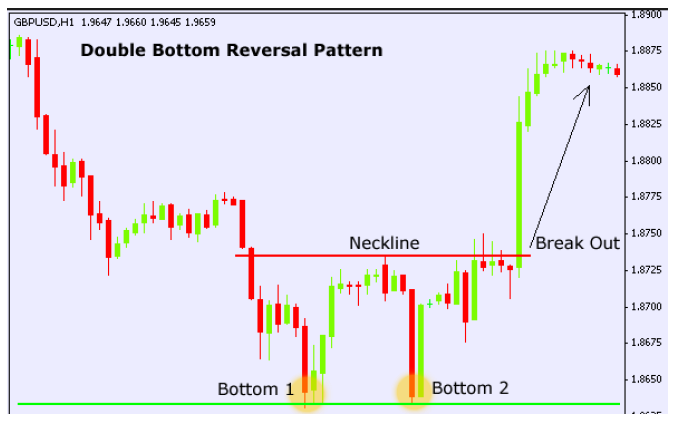
This is what a double bottom pattern looks like on a real forex chart:
3 Ways To Trade Double Bottom Chart Patterns
#1: Trade the breakout of the neckline:
Many traders once they see that the double pattern has formed and the neckline is being tested, that’s when they get in as soon as a breakout happens.
#2: Wait to enter on a retest of the Broken Neckline
Then there are other groups of traders that like to enter when the price reverses back down to touch the neckline, which now would act as a support level. Once it hits that neckline level they buy.
#3: Buy on bottom 2. In this way, you have the potential to ride the trade all the way up if the neckline is intercepted. You should consider buying on the bottom 2 as buying on a support level Look for bullish reversal candlestick patterns for trade entry signals.
How To Set Take Profit Levels On The Double Bottom Chart Patterns
- If you buy on bottom 2, you can use the neckline as your take profit level, or any previous highs above that as well.
- If you buy the breakout of the neckline, use the distance between the bottom and the neckline in pips to calculate your profit target. See chart below for example:
Double Top Chart Patterns
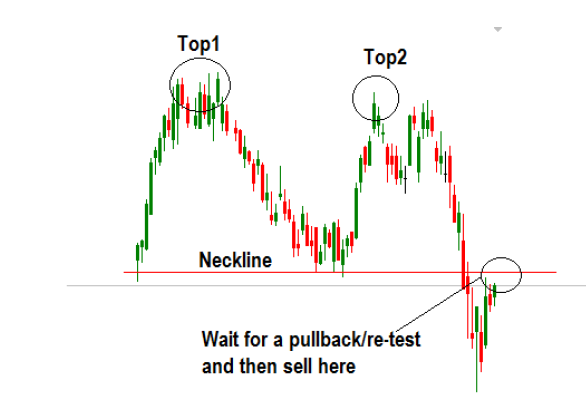
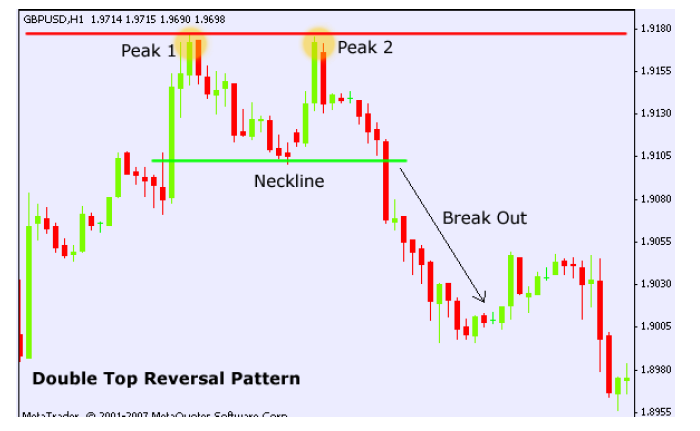
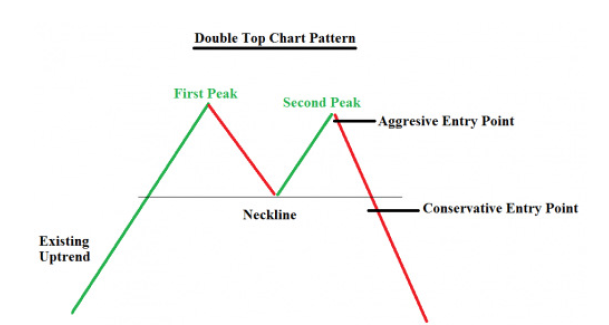
A double top chart pattern is a bearish reversal chart pattern and when found in an uptrend and once the neckline is broken, that confirms a downtrend. The double tops are very powerful patterns and if you get into a trade at the right time, you stand to make a lot of profits when the breakout happens to the downside.
Here’s an example of a double top Chart Pattern shown below:
How to Trade the Double Top Chart Patterns
There are 3 ways to trade the double-top chart pattern:
#1: Trade the initial breakout of the neckline.
#2: The technique I like most to take a sell trade on Peak 2 when I see a bearish reversal candlestick. And if price moves down and intersects the neckline and continues to do down further, your profits are dramatically increased.
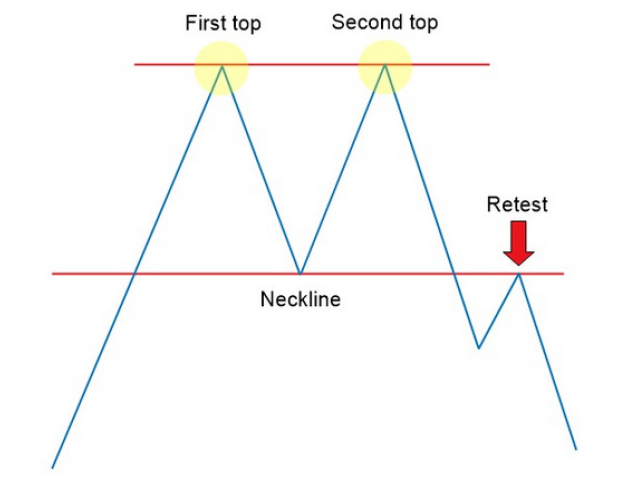
3: You can wait for price to go back up to test the broken neckline (which would now act as resistance level) and when you see a bearish reversal candlestick pattern, go short (sell) as this example below shows:
This is how it would look like in a real forex chart:
How to Take Profit On The Double Top Chart Patterns
Use the previous low (support levels) to set take-profit targets. Or another option would be to measure the distance between the neckline and the highest peak (the range) and use that difference in pips as take profit target if you are trading the breakout from the neckline.
As always, we encourage you to go back to your charts and test these patterns using past data. that way you will train your eye to see these kinds of setups and you can learn how they worked and see which ones failed.
You can also look at the number of setups that would have been profitable out of say, 20 setups. Such an exercise will reinforce your trust in the profitability of these setups. there is nothing like finding out for yourself if a pattern is profitable or not. So do not be lazy, go out there and spend some time on your charts.
The Triple Bottom Chart Patterns
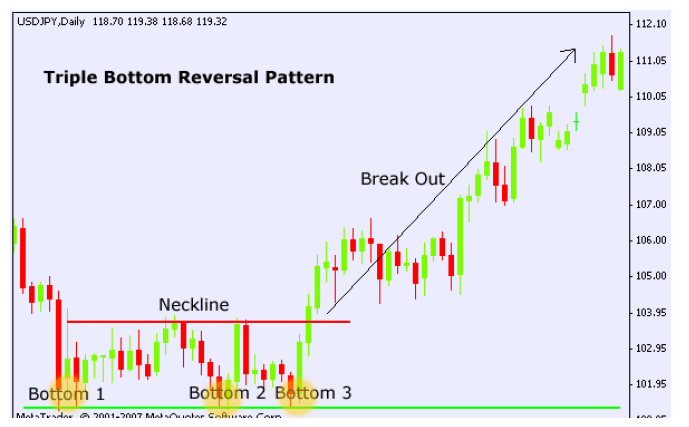
A triple top is a reversal pattern that is less common than the double top. It looks like this:
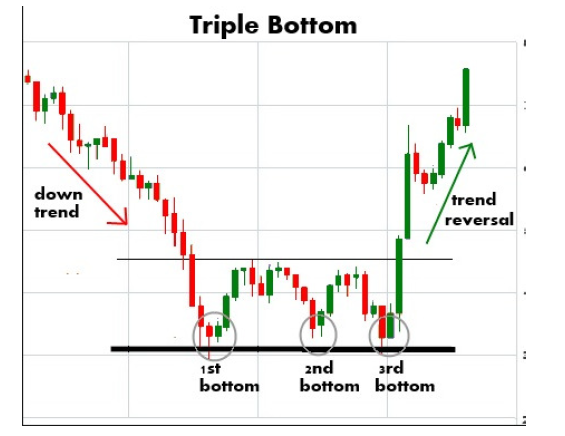
Triple bottoms are bullish reversal chart patterns, which means if found in a downtrend and this pattern starts to form and once the neckline is broken and price head up, this confirms that the trend is up.
Here’s another example of a triple bottom shown below:
How to Trade The Triple Bottom Chart Patterns
- Many traders wait until the neckline is broken and trade the initial breakout.
- Others will wait for a retest of the broken neckline to enter a buy order once they see a bullish reversal candlestick…
- I prefer to take trades on the 3rd bottom by watching the price action. If I see a bullish reversal candlestick pattern, I buy. Why do I do that? Well, if price goes up and breaks the neckline and goes upward, I would be in a lot more profit than if I bought the breakout of the neckline.
Profit-taking methods would be similar to the double bottom chart pattern mentioned previously…
The Triple Top Chart Patterns
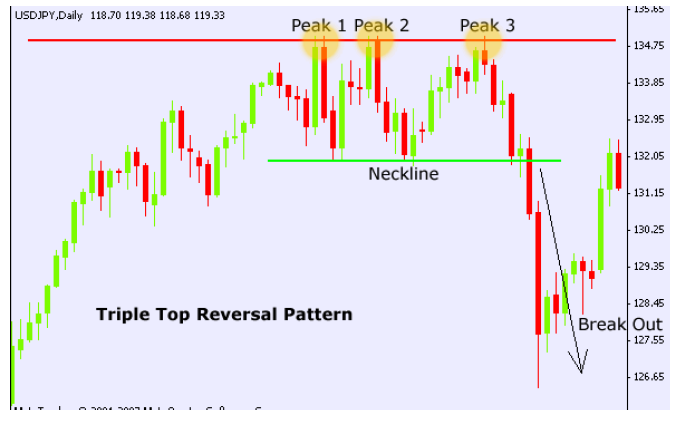
Triple tops are the opposite of triple bottoms and they are bearish chart patterns. They rarely occur but its good to know what they look like.
Triple tops when found in an uptrend, it signals the end of the uptrend when the neckline is broken and price heads down.
How To Trade The Triple Top Chart Patterns
- Some conservative traders wait for the neckline to be broken to trade that breakout.
- Some will most likely wait for a retest of the neckline and then sell.
- I prefer to take trades on Peak 3 and if the trade breaks the neckline and goes all the way down, I have a lot more profit to make. The key to taking a good trade on peak 3 is by looking for bearish reversal candlesticks. These are your signals to go short.
- If you take a trade at peak 3, your profit target can be the neckline.
- Or if you take a trade on the breakout of the neckline, measure the distance in pips between the neckline and the highest of the 3 peaks and use that distance to calculate your profit target. Or you can use a previous low and use that as your take profit target level as well.
Take your time to backtest these forex chart patterns and see how you could have traded them. You can even check your synthetic indices charts.
Explore The Chapters In The Price Action Course
Share this using the buttons below














Other Posts You May Be Interested In
Forex Correlation Strategy
This forex correlation strategy is based on Currency Correlation. WHAT IS CURRENCY CORRELATION? Currency correlation is a behaviour [...]
How To Verify Your Deriv Account
You can trade and withdraw on Deriv without verifying your account but you will face [...]
Why You Should Be Trading Price Action?
Price action represents collective human behaviour. Human behaviour in the market creates some specific [...]
Trade The Obvious
We hope you have learnt how powerful price action trading can be. Now, not all [...]
Brokers Offering Copy & Social Trading
Are you looking for the best list of copy trading platforms? Then look no further [...]
Heikin Ashi Forex Trading Strategy
Heikin-Ashi candles are a variation of Japanese candlesticks and are very useful when used as [...]