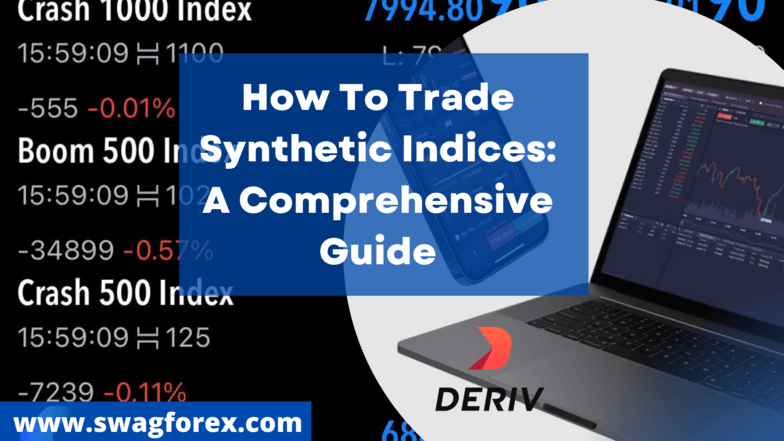
Synthetic Indices have been traded for over 10 years with a proven track record for reliability are they are still rising in popularity amongst traders the world over. However, there are still some misconceptions around them and in this post, we will explain what these synthetic indices are and why you should be trading them. […]
Category Archives: Learn Forex
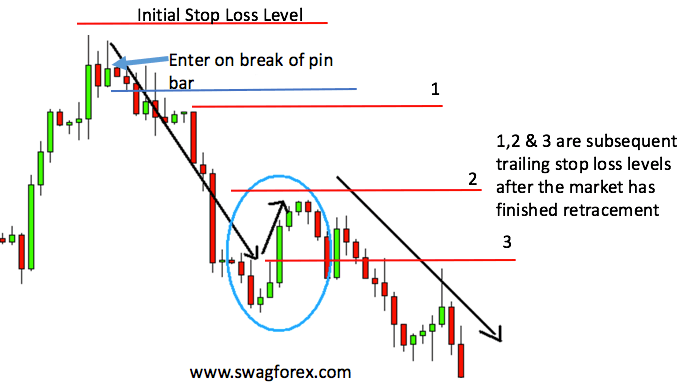
Stop-loss orders and take-profit orders are a very critical part of trading. In fact, they should be part of your exit strategy in your trading plan. Before you take any trade you must already know where you will exit that trade either in profit or loss. Stop loss and take profit orders are the exits […]
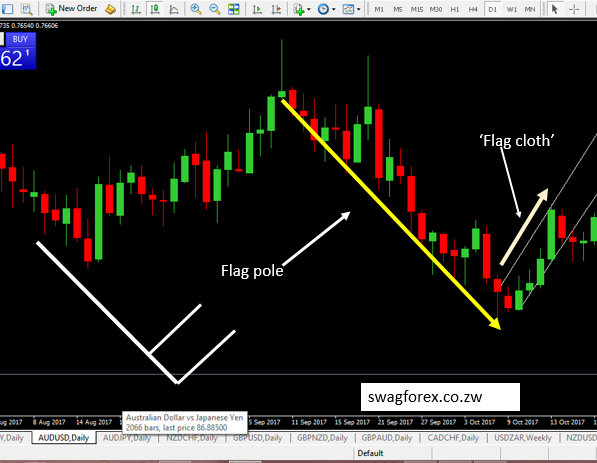
Flags and pennants are popular continuation patterns that every trader must know. Flags and pennants closely resemble each other, differing only in their shape during the pattern’s consolidation period. These patterns are usually preceded by a sharp rally or decline with heavy volume, and mark a midpoint of the move. Flags and Pennants patterns closely […]
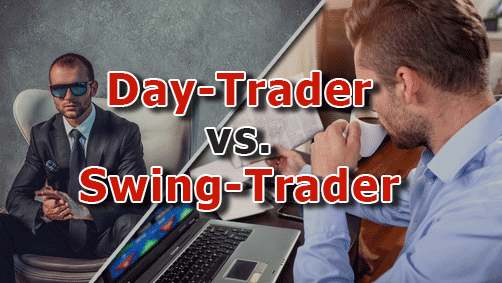
What Is Day Trading? This is the definition of day trading in the context of forex trading: buying and selling of currency pairs over a one-day period with the objective of profiting from the price moves that are made within that day. Day trading is also known as ‘Intraday trading’ where day traders are usually […]
The candlestick chart is the most common among traders. The candlestick chart had its origins in Japan and can also be referred to as the Japanese candlestick chart. The colour of the candlestick chart tells you if the price was up or down in a particular timeframe which means that candlesticks are either bullish or […]
Here are the main differences between technical analysis and fundamental analysis… Technical Analysis: technical analysis starts with a chart. technical analysts take a much shorter time horizon to do their technical analysis using time frames from a week, days, hours and even minutes. Fundamental Analysis: fundamental analysis starts with a financial statement. fundamental analysts take a […]
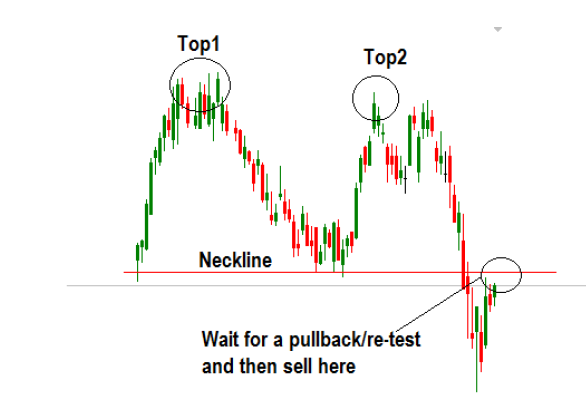
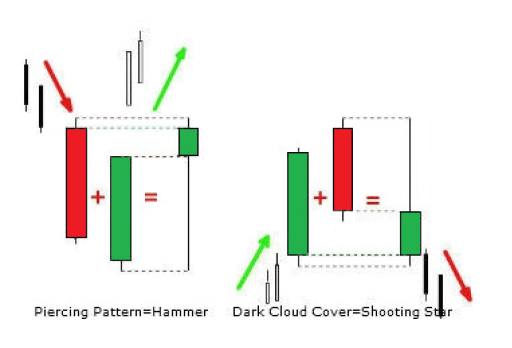
There’s a difference between chart patterns and candlestick patterns. Chart patterns are not candlestick patterns and candlestick patterns are not chart patterns: Chart patterns are geometric shapes found in the price data that can help a trader understand the price action, as well as make predictions about where the price is likely to go. Candlestick patterns, on the other hand, can involve only […]
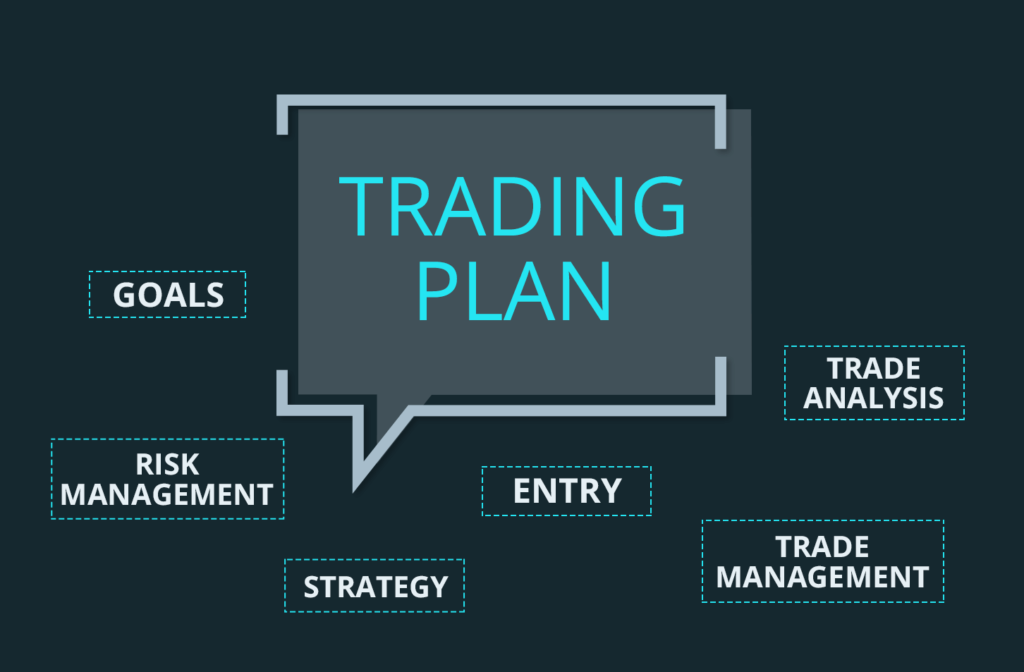
Trading is a risky business, so you need to plan to manage the inherent uncertainty of the markets You need to structure your trading business in the same you would a typical business. As the adage goes, if you fail to plan, then plan to fail. Trading is a risky business, so this adage is […]