As we explained on the part on how you make money in Forex, making the accurate forecasts of future price movements is the difference between making or losing money in trading. I also showed you that traders rely on technical and fundamental analysis to make these forecasts.
We will begin with technical analysis. You can read about the difference between technical and fundamental analysis here.

What Is Technical Analysis?
Technical analysis is a method for forecasting of the future direction of price movement based on the study of past market data. This market data is mainly price.
Anyone who researches and analyzes the market based on past price data, as well as technical indicators, is a technical analyst.
So if you learn about price action trading, chart patterns, candlesticks, forex indicators and use them in your trading later on, then you are a technical analyst.
Why?
Because you are basing your trading decisions (to buy or sell) on technical analysis you have done.

What Do Technical Analysts Believe In?
There’s one important thing (pure) technical analysts believe in and this is it: that price movements are the result of supply and demand forces in the market for any given currency pair.
This belief system makes technical analysts completely opposite to fundamental analysts.
What Tools Do Technical Analysts Use?
Technical analysts use many tools and techniques. The main one is the chart. A chart represents price behaviour over time.
There are 3 main types of charts used
What Candlestick Patterns Do Technical Analysts Look For?
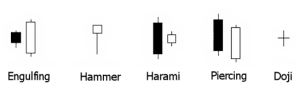
Technical traders also look for specific candlestick patterns to give them an indication of the likely direction price is going to move.
So what’s the difference between chart patterns and candlestick patterns?
Chart patterns usually involve a lot more candlesticks than single candlesticks. These can be spaced sporadically over time, and it needs a keen eye to actually pick out the patterns that are forming.

With candlestick patterns, at the most, it involves 1-2 candlesticks that form next to each other.
The best resource for you to learn more about candlestick patterns are these links below:
- top reversal candlestick patterns
- if you want more details of each of the top 10 reversal candlesticks including how and why and why causes them to form, then click here.
What Indicators Are Used In Technical Analysis?
There are many indicators that forex traders can use.
Most of these forex indicators are derived from price and to a lesser extent, volume.
Here are 4 Popular Technical Analysis Indicators For Trend Identification:
- moving average (for example, if moving average is pointing up and the price is travelling above the moving average line then the trend is up, the opposite for downtrend)
- bollinger bands
- parabolic SAR.
- average directional movement index
What are the Main Things Technical Analysts Look For In A Chart?
(1) Trends
- When price is heading up, that is called an uptrend and long (buy) trades will be preferable
- when price is heading down, that is called a downtrend and short (sell) trades will be more favourable.
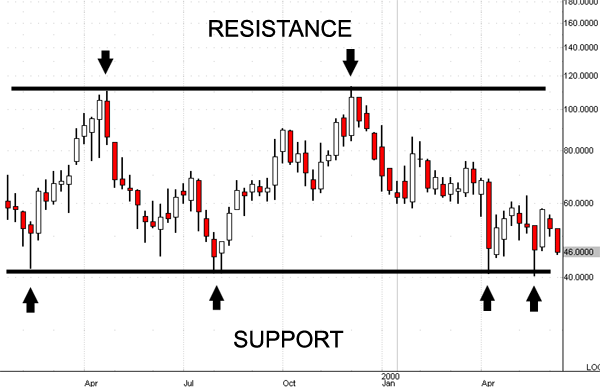
(2) Support levels
- A price level where price heads down and bounces up from significantly is a support level.
- spotting them on a chart is very easy, look for “valleys” or bottoms
- support levels provide traders good buying opportunities
- the use of bullish reversal candlesticks for trade entries enhances your trading strategy in this situation.
- trading strategies like this support and resistance forex trading strategy can be really handy.
(3) Resistance Level
- resistance levels are opposites of support levels and by definition, resistance levels are price levels where price goes up, hits it and moves back down.
- spotting them on charts is really easy….look for a ‘mountain tops” or peaks
- resistance levels provide very good selling opportunities
- the use of bearish reversal candlesticks to sell greatly enhances your trade entries.
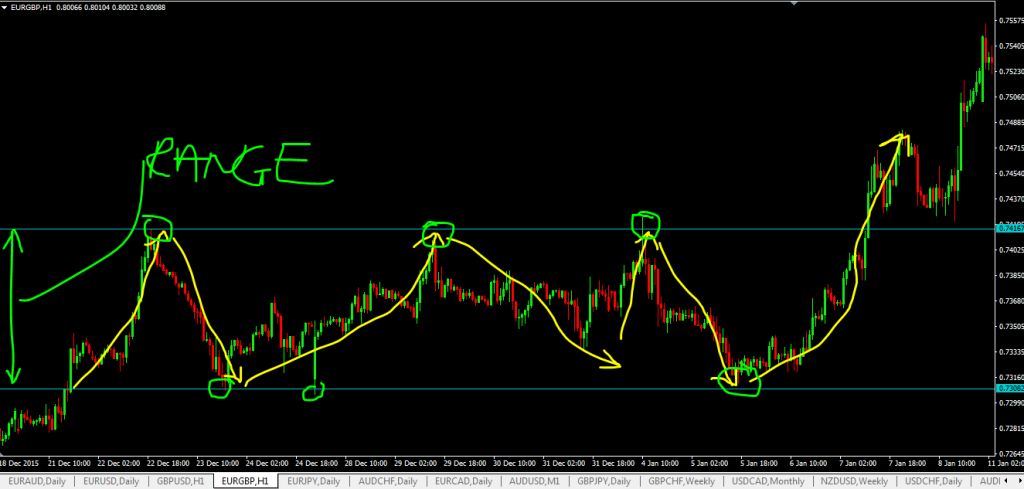
(4) trading ranges or price channels
- price ranges can also be called channels and looks like a ball bouncing in a narrow tunnel until eventually, price will break out of this narrow range either up or down.
- price channels are in fact support and resistance levels at work, so price bounces between the support and resistance levels.
- price channels can be horizontal like shown in the graph below, or they can be diagonal price channels.
What Is The Core Of Technical Analysis?
Price!
Why?
Because price often precedes fundamental developments and therefore it really makes sense to look directly at price movements.
Learn More About Technical Analysis (Especially Price Action) from our price action trading course.