Explore The Chapters
8. Profitable Chart Patterns Every Trader Needs To Know
9. How To Trade Fibonacci With Price Action
10. How To Trade Trendlines With Price Action
11. How To Trade Moving Averages With Price Action
12. How To Trade Confluence With Price Action
13. Multiple Time Frame Trading
15. Precautions & Conclusion With Price Action Trading
Nothing is more noticeable on any chart than support and resistance levels. These levels stand out and are so easy for everyone to see!
Why? Because they are so obvious.
As a matter of fact, support and resistance trading is the core of price action trading. Even synthetic indices charts show clear support and resistance levels.
The key to successful price action trading lies in finding effective support and resistance levels on your charts.

Now, in here, I talk about 3 types of support and resistance levels and they are:
The normal horizontal support and resistance levels that you are probably most familiar with.
Broken support levels become resistance levels and broken resistance levels become support levels.
Dynamic Support and Resistance Levels
Now, let’s look at each in much more detail.
Horizontal Support and Resistance Levels
These are fairly easy to spot on your charts. They look like peaks and troughs.
The chart below is an example and shows you to trade them:
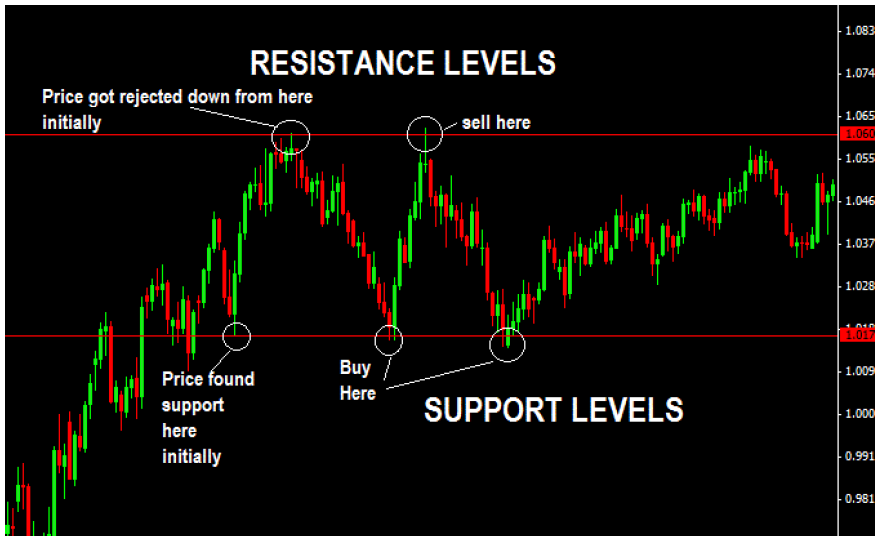
How To Find Horizontal Support And Resistance Levels On Your Chart
If price has been going down for some time and hits a price level and bounces up from there, that’s called a support level. You can check your synthetic indices chart for confirmation.
Price goes up, hits a price level or zone where it cannot continue upward any further and then reverses, that’s a resistance level.
So when price heads back to that support or resistance level, you should expect that it will get rejected from that level again.
The use of reversal candlestick trading on support and resistance levels becomes very handy in these cases.

Significant Support & Resistance Levels
Not all support and resistance levels are created equal on your forex chart. If you really want to take trades that have high potential for success, you should focus on identifying significant support and resistance levels on your charts.
Significant support and resistance levels are those levels that are formed in the large timeframes like the monthly, weekly and daily charts.
And when price reacts to these levels, they usually tend to move for a very long time.

Now, here’s the technique I use to trade setups that happen in larger timeframes:
I switch to smaller timeframes like the 4hr & the 1hr, 30min, 15min and even the 5min and wait for a reversal candlestick signal for my trade entries. This is so that I can get in at a much better price level as well as reduce my stop loss distance.
That’s what multi-timeframe trading is all about.
Support turned Resistance Level And Resistance Turned Support Level
Now, the next on is this thing called Support turned Resistance Level And Resistance Turned Support Level.
There are many traders that don’t realize that usually, in a downtrend, when a support level has been broken to the downside, it often tends to act as a resistance level. Here is an example shown on the chart below:
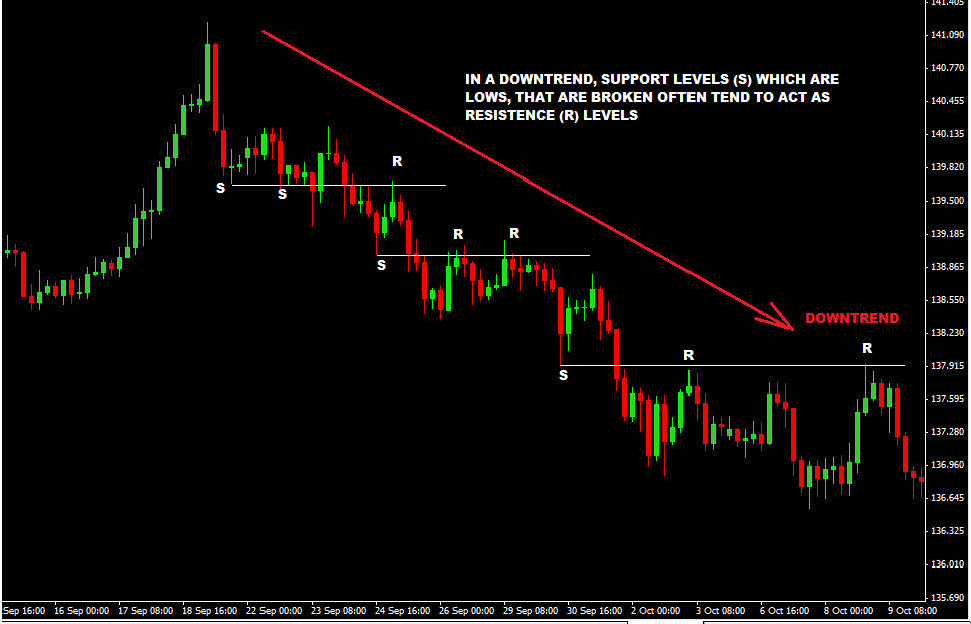
So when you see such happening, you should be looking for bearish reversal candlestick to go short. As a matter of fact these “R’s” are the upswings in a downtrend.
Similarly, in an uptrend you will also see such happening where Resistance levels get broken and when price heads back down to these, they now will act as support levels…Here’s an example:
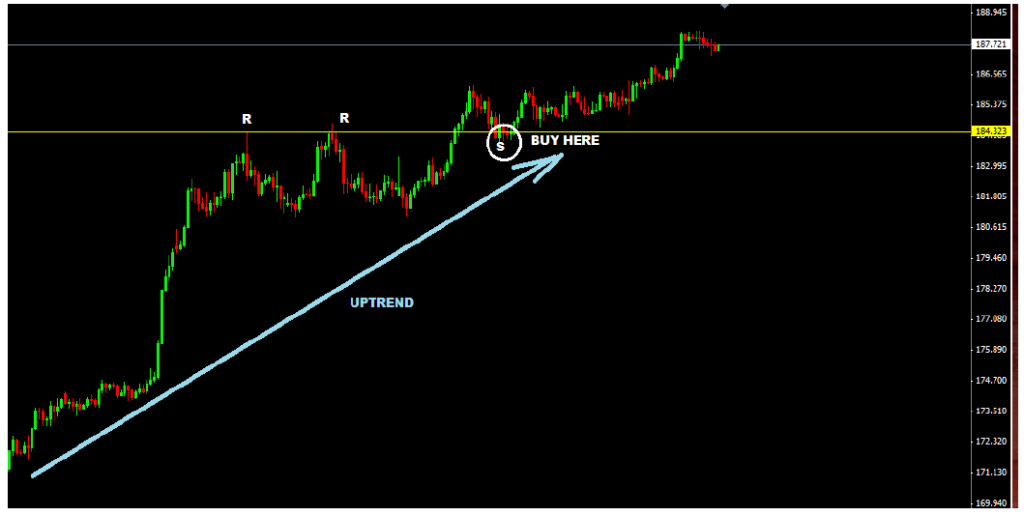
Look for bullish reversal candlestick around these type of resistance-turned-support levels as your signal to buy.
Can you see how the need for using other indicators is diminished once you understand how easy is to spot such trading setups like these?
Keep training your eye to see these through practice and your trading will improve by a wide margin.
Daily Inside Bar With Support And Resistance Level Breakout Trading Strategy
Bollinger Band With Horizontal Support And Resistance Forex Trading Strategy
MT4 Support And Resistance Indicator-Best Support And Resistance Indicator MT4
Explore The Chapters In The Price Action Course
Share this using the buttons below
Other Posts You May Be Interested In
How To Trade Forex On Deriv
Deriv is popular for its unique synthetic indices. But, did you know you can also [...]
How To Make Money Without Trading As Deriv Affiliate Partner
Do you know you can earn up to 45% lifetime commission on Deriv without placing any [...]
Comprehensive Guide To Trading With Stop-Loss Orders
Stop-loss orders and take-profit orders are a very critical part of trading. In fact, they [...]
Brokers Offering Copy & Social Trading
Are you looking for the best list of copy trading platforms? Then look no further [...]
Forex Forecast Week 26/23
Week 26/22 Forecast Where art thou bound, DXY? This is a very short-form analysis that [...]
Revealed: How To Become A Deriv Payment Agent
This post will teach you how to become a Deriv payment agent easily and make [...]