
Heikin-Ashi candles are a variation of Japanese candlesticks and are very useful when used as an overall trading strategy Forex.
Unlike regular Japanese candlesticks, Heikin-Ashi candlesticks do a great job of filtering out the noise that is common with Japanese candlesticks. They highlight the trend of the market more easily than other plotting methods. Let’s look at some of the differences between Heikin Ashi and Japanese Candlesticks.
HEIKIN ASHI VS JAPANESE CANDLESTICKS
The Heiken Ashi candlestick chart looks similar to its counterpart but the calculation of the candlestick gives it the different look.
- Looking at standard candlestick charts, each candlestick has four different prices: open, high, low & close. Each candlestick that is formed has no relationship except opening price (except in some cases) to the candlestick that came before it.
- A Heikin Ashi candlestick is calculated using some information from the previous candlestick:

These details are:
- Open price: Heikin Ashi candlestick is the average of the open and close of the previous candlestick
- High price: Chosen from the one of the high, open and close price of which has the highest value.
- Low price: Chosen from the one of the high, open and close price which has the lowest value
- Close price: The average of the open, close, high and low prices.
What that means is that each candlestick is formed on the Heikin Ashi chart is related to the previous one. The advantage of this is that it smoothes out the noise in standard Japanese candlestick patterns.
A few things to keep in mind:
- Because each candle relies on the previous candle for the calculation, it would be difficult for traders who trade gaps as a trading strategy
- Recent price will not be reflected in the last candle due to the averaging calculation used by the Heikin Ashi candlestick
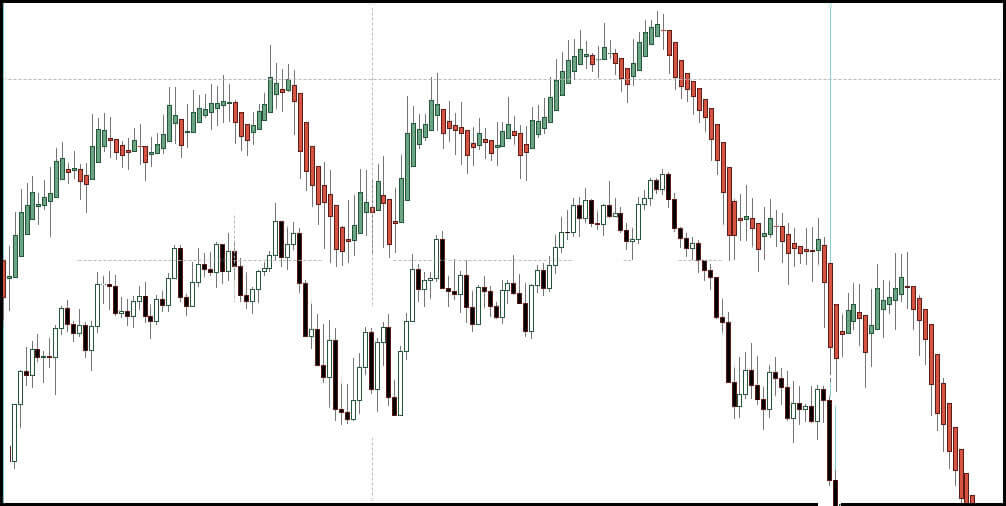
- Strong buying pressure will generally not have lower shadows (wicks)
- Strong selling pressure will generally not have an upper shadow. You can clearly see this on the chart above.
- If you start to see upper wicks on down HA candles and lower wicks on up HA candles, be alert for a weakening trend.

Is A Download Needed For The Heikin-Ashi Indicator?
Most charting platforms will have the option to plot price movements as a Heiken-Ashi candlestick. You can access that feature through your charting properties window.
If you are using MetaTrader 4 you can download the Heiken Ashi smoothed indicator by clicking here.
How Traders Can Read and Use The Heikin Ashi Candlestick
Heiken Ashi candlesticks charts are used in the same manner as normal Japanese candlesticks. We can quickly list 3 items that will allow you to understand the power of the HA candlesticks.
- Monitoring the presence of upper or lower shadows as described earlier can indicate the strength of the trend.
- The color of the heiken ashi candlestick is supposed to indicate the overall trend direction of the market.
- By following the trend direction as indicated by the colors of the candlesticks, you can potentially avoid being wrong-footed during whipsaw price action.

In brief: Heiken Ashi candlestick chart patterns allow you to stay with the overall trend by allowing you to avoid the noise or the minor fluctuations of price that is prevalent in a standard candlestick chart.
Simple Heikin-Ashi Forex Trading Strategy
Higher time frames tend to give stronger signals so keep that in mind when you trade using the HA
For our sample trading strategy, we will use the following:
- Daily Time Frame
- 20 EMA for monitoring pullbacks in price
- Trend direction as shown by the HA candles
- Monitor strength by using the shadows
- Use colour shift as a trade entry signal
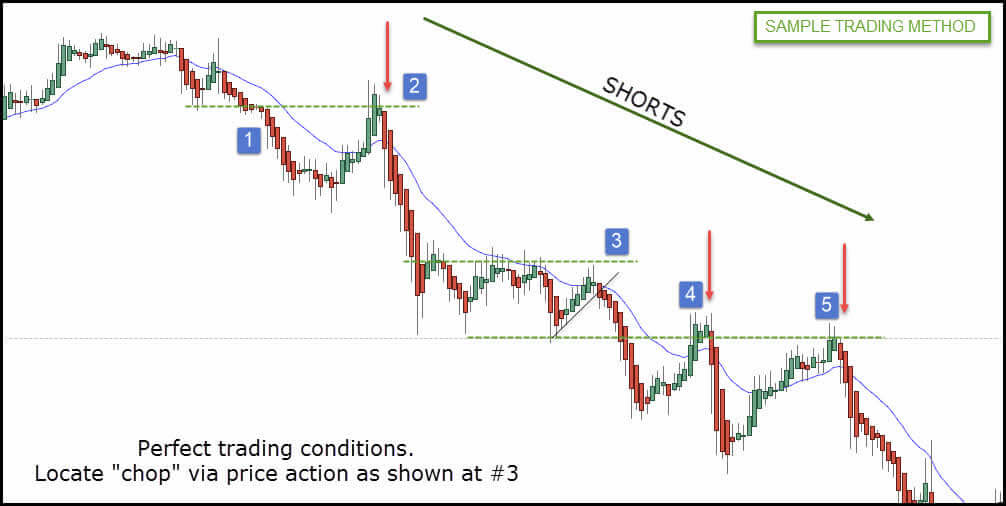
In the following chart, the 20 EMA shows the major trend on this daily chart. When we have the colour shifts in the Heikin Ashi, until price patterns and 20 EMA show a change of trend, we still look for shorting opportunities.
- Using what we know, these candles show a down-trending market and given little in the way of upper shadows, we will consider this a strong trend.
- Green candles show up and price rallies up and over the 20 EMA right into a zone that was once support. Will it be resistance? Sell stop the low of the first red Heikin Ashi candle to appear.
- Price consolidates and slides sideways into the 20 EMA. This is NOT A PULLBACK TRADE! Price rejects, puts in a lower rejection, draw a bear flag, position before the break of support at first red candle
- Nice rally into 20 EMA and previous support zone. Large red candle. You may opt to pass on this trade due to the size of this candle.
- Another rally up to 20 EMA and same zone as #4. Nice short trade.
Management Of These Forex Trades
We must place our stop loss when we enter a trade and in this case, a distance above the pivots highs would be a decent spot. You don’t want it just beyond the pivot as you will be a victim of stop hunts from time to time.
You can set profit targets at the pivot lows the occur before the pullbacks. You can also take advantage of one of the best things about Heikin Ashi trading and that is to use the same exit method as you do entries. You can exit your trade once the color flips.
If you want more active management during the trade, test out trailing your stop and tightening it when the presence of upper shadows (in a downtrend) show on the HA candles as this indicates weakness.

Is This The Best Heikin Ashi Strategy?
I will tell you right now there is no best strategy however there IS a best trading strategy for you!
Some traders may find the simple strategy a little too…..simple. These traders may need a little more framing of the market to aid in their trading. These traders may find the following strategy more to their liking.
Buying Rules:
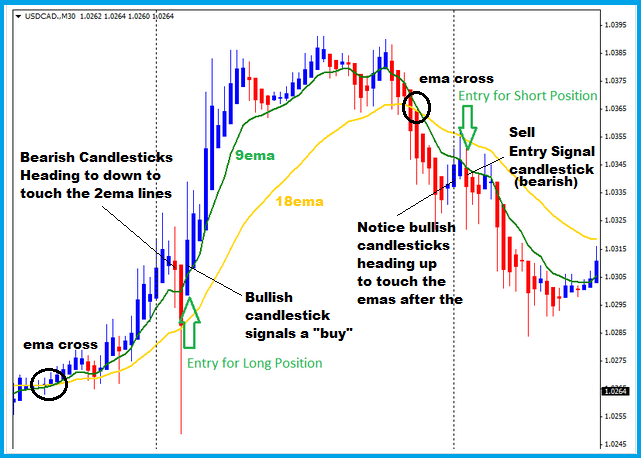
- 9 exponential moving average must cross 18 exponential moving average up.
- Price has to extend from the EMAs (think of a rubber band).
- Wait to see if you a bearish heiken ashi candlestick starts forming and heading back to touch the ema lines. If you see this happening, you should sit up and take notice because a buy setup may be just around the corner.
- Your actual buy signal is the bullish heiken ashi candlestick that forms after that those bearish heiken ashi candlesticks in step 3 has touched the ema line(s)
- Open a buy order at market.
- For your stop loss, place it above the low of the buy entry signal heiken ashi candlestick.
Selling Rules:
For selling, just do the exact opposite of buying:
- 9 exponential moving average must cross 18 exponential moving average down.
- Price has to stretch from the EMA lines.
- Wait to see if a bullish heiken ashi candlestick starts forming and heading back to touch the ema lines. If you see this happening, you should sit up and take notice because a sell setup may be just around the corner.
- Your actual sell signal is that bearish red heiken ashi candlestick candlestick that forms after that those bullish candlesticks in step 3 has touched the EMA line(s)
- Open a sell order at market.
- For your stop loss, place it above the high of the sell entry signal heiken ashi candlestick.

How To Set Take Profit Targets
- Set your profit at set at 2 or 3 times your risk. For example, if you risked 30 pips, then set your profit target at 60 pips or 90 pips. However, you should take into account key areas (support and resistance) in the direction of your trade.
- Another way to set profit target is to identify previous swing highs for profit target for buy orders and previous swing lows for your profit target for sell orders. But here’s the thing: you have to switch to the normal candlestick chart to do this.
Trade Management
Note, for this trade management, you have to switch to a normal candlestick chart to do these
The best way to get more profitable pips out of a strong trend is to trail stop your trades using subsequent lower swing highs for sell trades and higher swing lows for buy trades.

For example
- If your sell trade is profitable and price has moved favorably, place your trailing stop a few pips behind those consecutively decreasing tops of lower swing highs as the price moves lower.
- similarly, if your buy trade is profitable, place your trailing stop a few pips behind those consecutively increasing bottoms or higher swing lows as price moves higher.
The reason for using the trailing stop this way is so that you give the market room to breathe and so you do not get stopped out prematurely.
DISADVANTAGES OF THE HEIKEN ASHI CANDLESTICKS STRATEGY
This Forex trading strategy works when the market is trending but when the market is ranging, you may get stopped out with false setups. You MUST have an understanding of price action and structure to avoid being chopped up in those markets.
Stop loss may be large so ensure you use a proper position sizing model to place your stop. You may elect to use the Japanese candlestick chart to place your stop and then switch back to your Heikin Ashi for management.
Other Posts You May Be Interested In
Inside Bar Forex Trading Strategy
The inside bar forex trading strategy can be classified as a simple price action trading [...]
How To Transfer Funds From One Deriv Account To Another
It is now possible to transfer funds between two Deriv accounts belonging to two different traders [...]
Revealed: How To Become A Deriv Payment Agent
This post will teach you how to become a Deriv payment agent easily and make [...]
FBS Broker Review. All You Need To Know ☑️ (2024)
FBS is an online broker that offers financial market trading in forex and CFDs. This [...]
The Best Forex Demo Contests (Updated 2024)
Below is a list of the best and current forex demo account contests. Broker [...]
Forex Correlation Strategy
This forex correlation strategy is based on Currency Correlation. WHAT IS CURRENCY CORRELATION? Currency correlation is a behaviour [...]