Explore The Chapters
8. Profitable Chart Patterns Every Trader Needs To Know
9. How To Trade Fibonacci With Price Action
10. How To Trade Trendlines With Price Action
11. How To Trade Moving Averages With Price Action
12. How To Trade Confluence With Price Action
13. Multiple Time Frame Trading
15. Precautions & Conclusion With Price Action Trading
Top Forex Brokers For You
What Is Price Action Trading?
Price action is the study of a forex pair’s price movement.
To really understand price action means you need to study what happened in the past. You must then observe what is happening in the present and then predict where the market will go next.
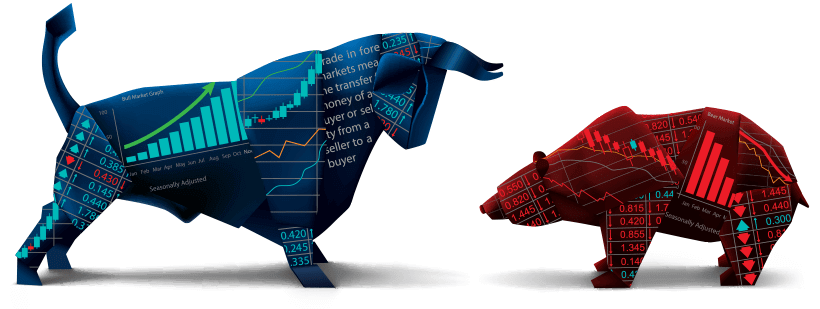
All price movement in Forex comes from bulls (buyers) and bears (sellers). The Forex market is ultimately in a constant state of struggle between bulls and bears. Price action trading is about analysing who currently controls price, bulls or bears and if they are likely to stay in control.
Price action trading uses tools like charts patterns, candlestick patterns, trendlines, price bands, market swing structure like upswings and downswings, support and resistance levels, consolidations, Fibonacci retracement levels, pivots etc.
Generally, price action traders tend to ignore the fundamental analysis-the underlying factor that moves the markets. Why? Because they believe everything is already discounted for in the market price.
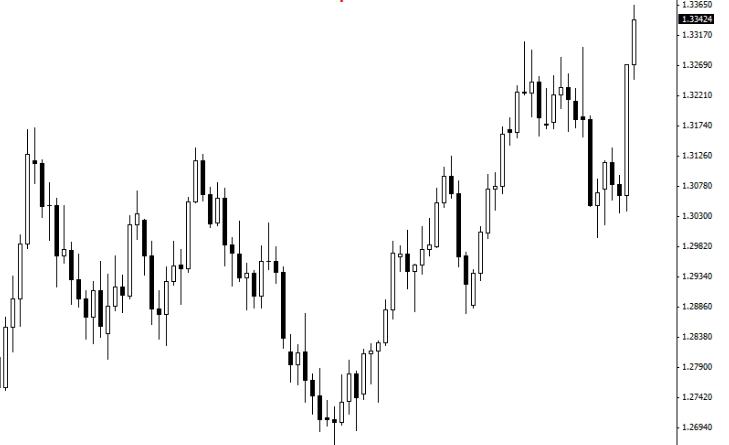
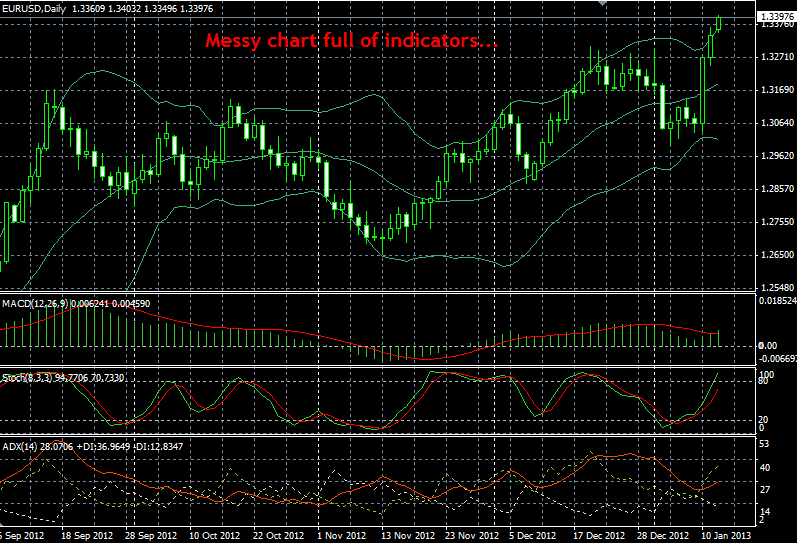
Price action trading uses a clean chart without indicators. Take a look and compare the two charts below.
It’s worth pointing out how in the indicator-laden chart you actually have to give up some room on the chart to have the indicators at the bottom. This forces you to make the price action part of the chart smaller, and it also draws your attention away from the natural price action and onto the indicators. So, not only do you have less screen area to view the price action, but your focus is not totally on the price action of the market like it should be.
If you really look at both of those charts and think about which one is easier to analyze and trade from, the answer should be pretty clear. All of the indicators on the chart below, and indeed almost all indicators, are derived from the underlying price action.
In other words, if you add indicators to your charts you just produce more variables for yourself; you don’t gain any insight or predictive clues that aren’t already provided by the market’s raw price action.
Before you get started, these are some words that you may encounter:
Long= buy
Short= sell
Bulls= buyers
Bears= sellers
Bullish=if the market is going up, it is said to be bullish (uptrend).
Bearish=if the market going is down, it’s said to be bearish.
Bearish Candlestick=a candlestick that has opened higher and closed lower is said to be bearish.
Bullish Candlestick=a candlestick that has opened lower and closed higher is said to be a bullish candlestick.
Risk: Reward Ratio=if you risk $50 in a trade to make $150 then your risk: reward is 1:3 which simply means you made 3 times more than you risked. This is an example of risk: reward ratio.
You can learn more about forex terms in the glossary.
Now, the next chapter of the price action trading course, you are going to learn more about what price action is and lots more.
To practice price action you will need to open a forex account and you can choose any broker below to open the free account.
Top Forex Brokers For You
Explore The Chapters In The Price Action Course
Share this using the buttons below


Other Posts You May Be Interested In
Day Trading
What Is Day Trading? This is the definition of day trading in the context of [...]
Skrill & Neteller No Longer Allowing Deposits To Deriv & Other Brokers
Popular e-wallets Skrill and Neteller have stopped processing deposits and withdrawals to and from Deriv and [...]
1. Introduction To Price Action
What Is Price Action Trading? Price action is the study of a forex pair’s price [...]
Trade The Obvious
We hope you have learnt how powerful price action trading can be. Now, not all [...]
FBS Broker Review. All You Need To Know ☑️ (2024)
FBS is an online broker that offers financial market trading in forex and CFDs. This [...]
How To Trade Fibonacci With Price Action
Fibonacci retracement levels were discovered by an Italian mathematician by the name of Leonardo Fibonacci [...]