Explore The Chapters
8. Profitable Chart Patterns Every Trader Needs To Know
9. How To Trade Fibonacci With Price Action
10. How To Trade Trendlines With Price Action
11. How To Trade Moving Averages With Price Action
12. How To Trade Confluence With Price Action
13. Multiple Time Frame Trading
15. Precautions & Conclusion With Price Action Trading
Fibonacci retracement levels were discovered by an Italian mathematician by the name of Leonardo Fibonacci in the thirteenth century. Leonardo Fibonacci had his “Aha!” moment when he discovered that a simple series of numbers that created ratios could be used to describe the natural proportions of things in the universe.
Many traders don’t realize that Fibonacci levels have been around far longer than the Forex market itself.
In fact, the series of numbers that Mr Fibonacci discovered were used in everything from studies of the universe to defining the curvature of naturally occurring spirals, such as those found in snail shells and the pattern of seeds in flowering plants.
Yes, you read that right – snail shells and flowering plants.
So what is this series of numbers that he discovered?
The Foundation of Fibonacci Retracement Levels
Unlike many Forex trading tools out there, the secret behind Fibonacci retracement levels is extremely easy to understand. This is because the levels are simply a derivative of a series of numbers.
The Fibonacci sequence of numbers is as follows:
0, 1, 1, 2, 3, 5, 8, 13, 21, 34, 55, 89, 144, etc.
If you notice, each number in the sequence is the sum of the preceding two numbers. So if we broke this down it would look like the following…
0+1=1
1+1=2
2+1=3
3+2=5
5+3=8
etc.
This pattern continues infinitely. At this point, you may be asking why this is so special. Well, for starters each number in the sequence is approximately 1.618 times greater than the preceding number. So although the numbers are different, they all have this common characteristic.
Now, I don’t know about you but one thing I continue to see is that price action respects Fibonacci levels…not all the time but when it does, some of the market moves generated can make you money very easily. The trick is to use Fibonacci and combine it with price action by using reversal candlesticks.
But first, if you’ve never heard about the Fibonacci retracement tool, then here’s a brief introduction…
What Is The Fibonacci Retracement Tool?
This tool is a series or sequence of numbers identified by a guy called Leonardo Fibonacci in the 13thCentury.
So what actually is a Fibonacci Retracement?
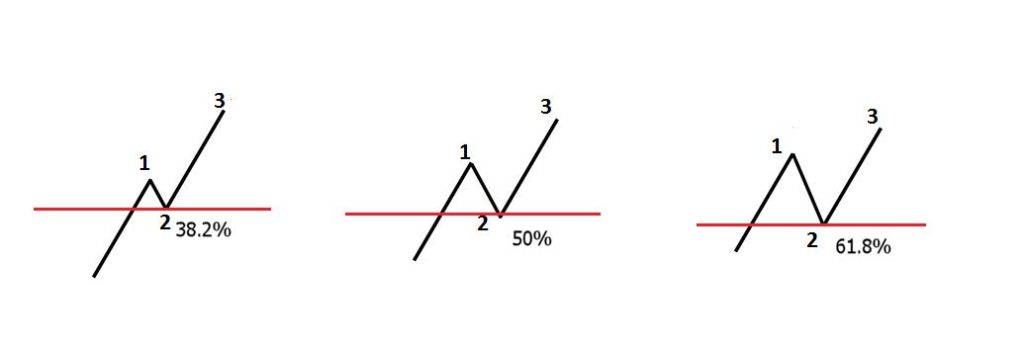
In technical analysis, Fibonacci retracement is created by taking two extreme points (usually a major peak and trough) on your forex chart and dividing the vertical distance by the key Fibonacci ratios of 23.6%, 38.2%, 50%, 61.8% and 100%. Once these levels are identified, horizontal lines are drawn and used to identify possible support and resistance levels.
The two fib levels I use the most are the 50% and 61.8%. I really do not focus at all on the others.
If you are using the Trading Platform, the Fibonacci tool has an icon as shown in the chart below:
Why You Need A Fibonacci Retracement Tool:
- In a downtrend, after price has been going down for some time, it will move back up (upswing…remember?). The Fibonacci retracement tool can help you estimate or predict potential price reversal areas or levels.
- Similarly, in an uptrend, price will make minor downtrend moves (downswings) and the Fibonacci retracement tool will help you predict potential reversals areas or price levels.
- If used in conjunction with support and resistance levels and combined with price action, they do really form a powerful combination and do give highly profitable trading signals. This describes something known as “price confluence”. I will talk more on that later.
How to Use the Fibonacci Tool On Metatrader4
It is actually a very simple 3 step process:
Step1: find a peak (upswing point/resistance level) and a trough (downswing point/support level)
Step 2: Click on the Fibonacci tool icon on your chart.
For the next steps, it’s all click and drag process…
Step 3a: In a downtrend market, you click first on the previous peak where you want to analyse from and drag down to the trough where the price reversed from and released.
Step 3b: In an uptrend market, click and drag first on the trough up to the peak and release.
That’s how simple it is to draw Fibonacci retracement levels on your charts.
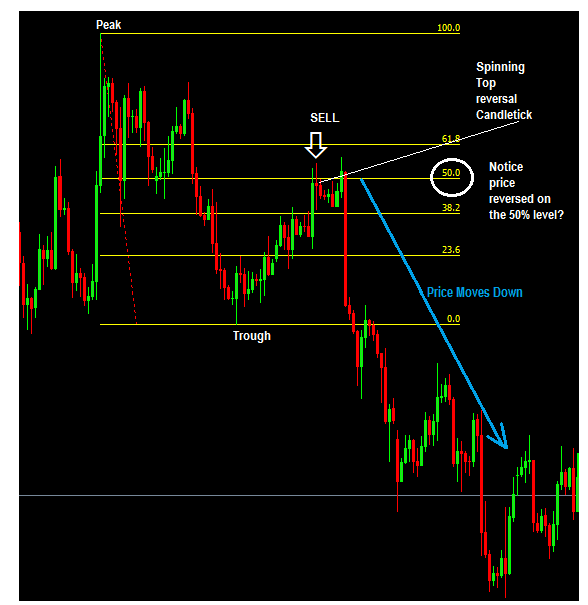
On the chart below notice that price formed a peak and then moved down, found support and formed a trough, and price went back up:
At around the 50% fib level, it starts to slow sign of losing the upward steam. You can also see the bearish spinning top candlestick which could have been used as a signal to go short (sell).
Can you buy or sell just based entirely on the fib numbers like 50% or 61.8% as soon as price reaches these levels without price action?
Well, I think that there are traders out there that do that and you can do that. But personally, I do not like that approach. I’d rather combine Fibonacci with reversal candlesticks, trend lines, support & resistance levels etc for trade entries.
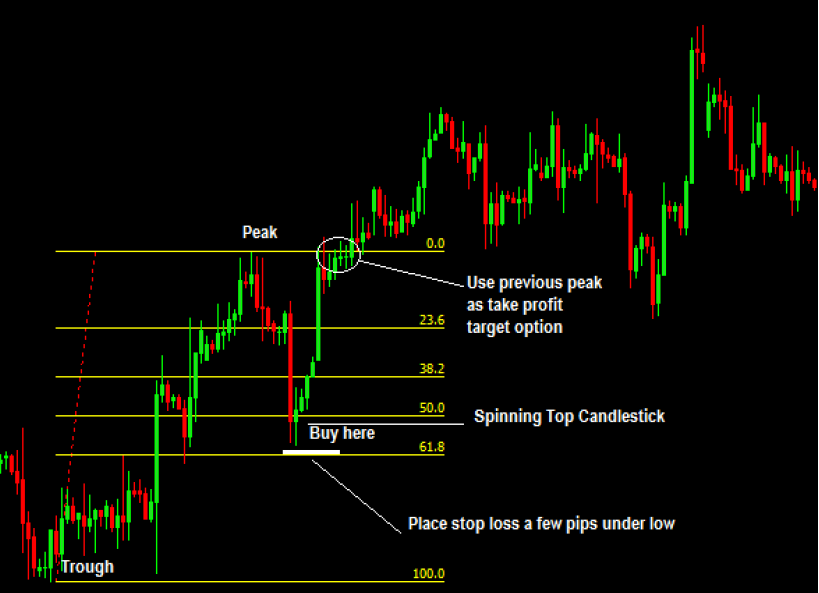
Let’s study the past… here’s an example of how to trade Fibonacci with price action in an uptrend. Notice the spinning top candlestick right at the 50% level which could have been used as a buy signal:
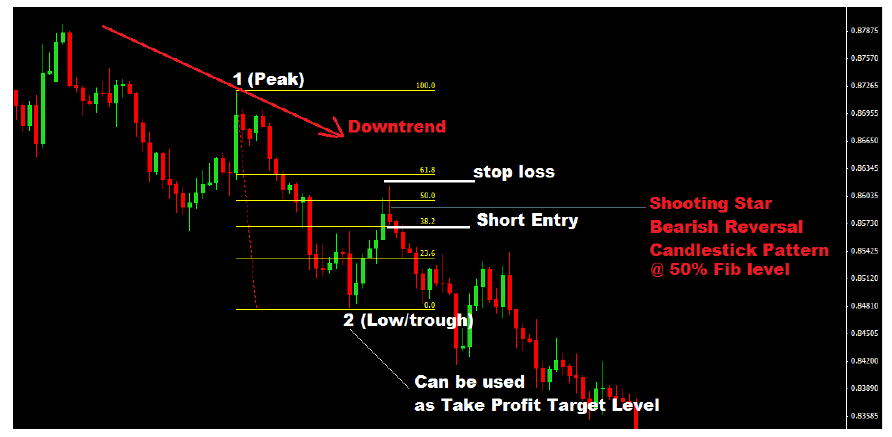
Here’s another example of how to trade Fibonacci with price action in a downtrend:
You can see that this is not complicated, isn’t it? Very simple trade setups. Your risks are small compared to the profits you potentially can make.
Explore The Chapters In The Price Action Course
Share this using the buttons below



Other Posts You May Be Interested In
How To Trade Moving Averages With Price Action
Many new traders that find it difficult to define the structure of a trending market, [...]
Multiple Time Frame Trading
What is Multi-timeframe Analysis Multiple time frame trading is the process of analysing the same [...]
Why You Should Be Trading Price Action?
Price action represents collective human behaviour. Human behaviour in the market creates some specific [...]
Profitable Chart Patterns Every Trader Needs To Know
There’s a difference between chart patterns and candlestick patterns. Chart patterns are not candlestick patterns and candlestick patterns are not chart patterns: Chart [...]
How To Trade Flags & Pennants
Flags and pennants are popular continuation patterns that every trader must know. Flags and pennants [...]
What Is An Islamic Forex Account?
What Is An Islamic Forex Account? An Islamic, or ḥalāl forex trading account is a [...]