Explore The Chapters
8. Profitable Chart Patterns Every Trader Needs To Know
9. How To Trade Fibonacci With Price Action
10. How To Trade Trendlines With Price Action
11. How To Trade Moving Averages With Price Action
12. How To Trade Confluence With Price Action
13. Multiple Time Frame Trading
15. Precautions & Conclusion With Price Action Trading
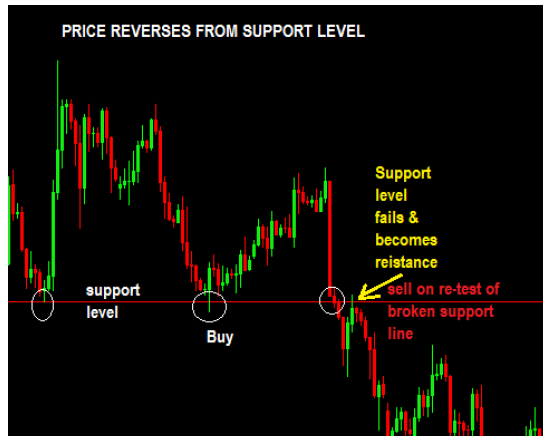
A reversal is a term used to describe when a trend changes (reverses) direction. This is a critical part of price action trading.
Now, where can reversals and continuation patterns happen?
- Support levels
- Resistance levels
- Fibonacci levels
Here’s an example of price reversing from a support level that went up and then later broke it and went down. Now that broken support level acts as resistance level when price came for a re-test of the level and sent the price tumbling down:

Now, what about continuation then?
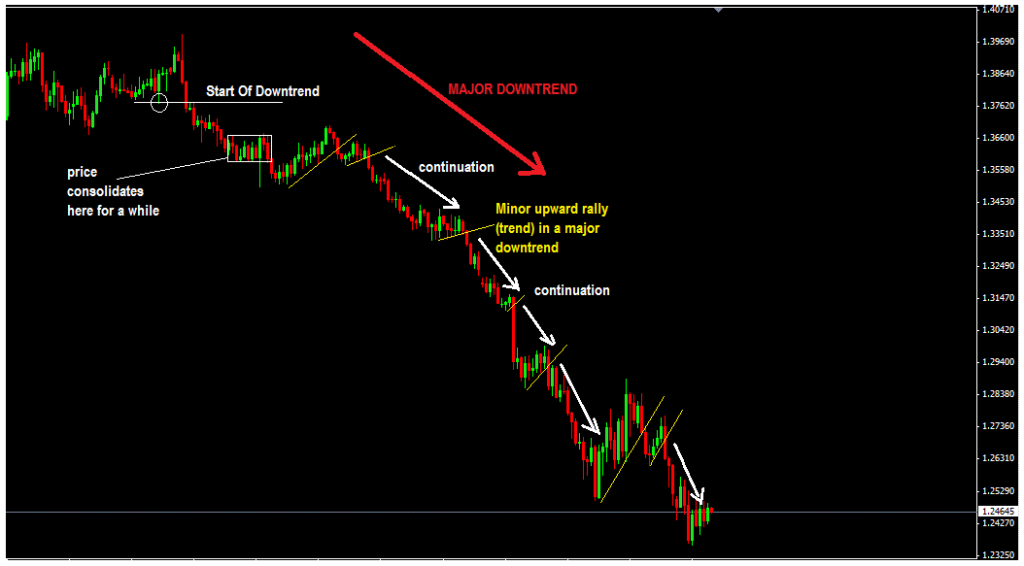
In simple terms, continuation means that there is a main trend, for example, an uptrend, that is happening… and you will notice that price slows down and maybe consolidates for a little while and may fall back down a little…it is like a minor downtrend in a major uptrend move called a downswing in a major uptrend.
So when that ends and price resumes in the original uptrend direction then that is called a continuation. The chart below makes this concept a bit clearer:
So the big question is: how to spot trend continuity and execute trades at the right time in forex trading?
The secret is in the identification of specific chart patterns as well as very specific candlesticks patterns and you will discover more on the Chart Patterns and Candlestick Patterns section of this course.
There are lots of candlesticks, but out of all of them only 9 that you really need to know. Why? Because there are very popular are really powerful so why waste time with the rest?
When these reversals & continuation candlestick patterns form at support and resistance levels or Fibonacci levels they are great trade entry signals.
1: The Doji Candlestick Patterns.
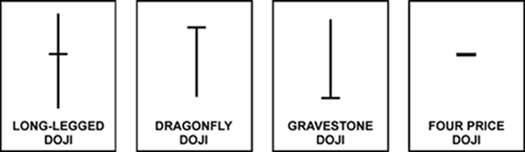 The doji candlesticks are single (individual) candlestick patterns. There are 4 types of doji candlesticks as shown below:
The doji cross can be both considered a bullish or bearish signal depending on where it forms.
The gravestone doji is considered a bearish reversal candlestick when formed in an uptrend or in a resistance level.
The dragonfly doji is considered a bullish candlestick pattern when formed in a downtrend or in a support level.
The long-legged doji shows a period of indecision by bulls and bears and depending on where it forms (uptrend/resistance level=bearish signal, downtrend/support level=bullish signal) it can be considered a bearish or bullish signal.
2: The Engulfing Candlestick Patterns
The engulfing patterns are 2 candlestick patterns.
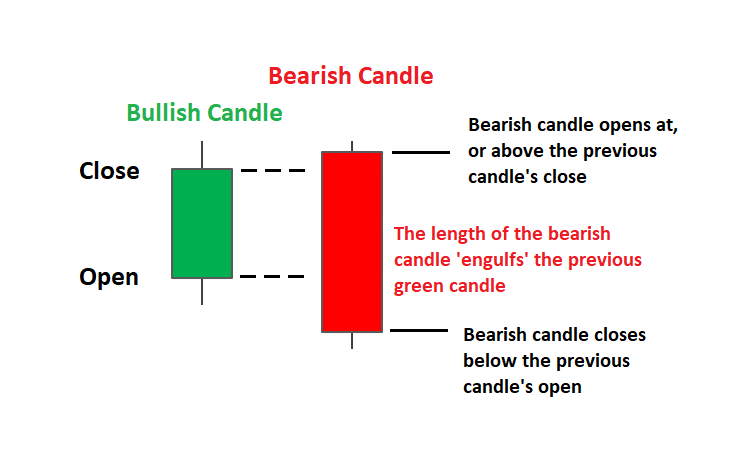 For a bullish engulfing pattern, you will see that the first candle is bearish followed by the second candle which is very bullish and this 2nd candle completely engulfs the first one.
Bullish Engulfing-when formed in a support level or in a downtrend, this can signal that the downtrend is potentially ending.
Bearish Engulfing-when formed in an uptrend or at a resistance level, this is a signal that the uptrend may be ending.
3: Harami Candlestick Patterns.
The harami is a 2 candlestick pattern and can be bullish or bearish.
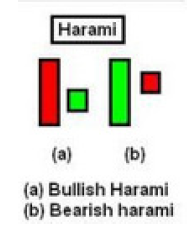 Bullish Harami-this is a 2 candlestick pattern. The first candlestick is a very bearish candlestick followed by a bullish candle, which is quite short and is completely covered by the shadow of the first candle. When you see this in a downtrend or in an area of support, this will be your bullish(buy) signal.
Bearish Harami is the exact opposite of bullish harami. When you see this pattern form in a resistance level or in an uptrend, this is a bearish reversal signal and may indicate that the uptrend is ending and you should go short (sell).
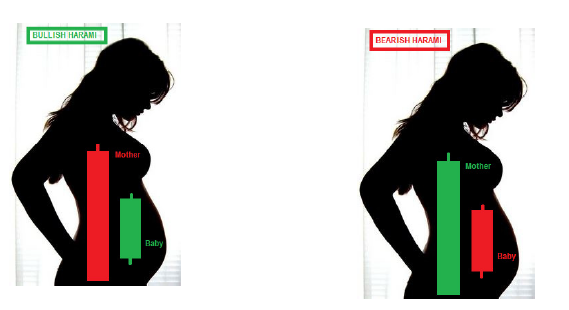
The easiest way to remember the harami patterns is to think about a pregnant woman and a baby inside her tummy:
4: Dark Cloud Cover Candlestick Pattern
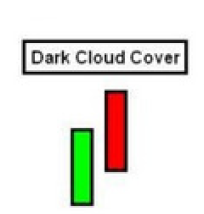 The dark cloud is another bearish reversal candlestick pattern formation consisting of 2 candlesticks. The first one is a bullish candlestick showing a strong upward momentum but when the second candle forms, it shows a completely different story…it’s bearish and it closes at about the midway point of the first candlestick.
When you see the dark cloud cover candlestick pattern in an uptrend or at resistance, it’s a bearish reversal signal and you should be thinking to go short (sell).
5: Piercing Line Candlestick Pattern
The piercing line is the opposite of dark cloud cover. You may see this in aa 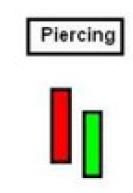 downtrend or form at a support level. The first candlestick is very bearish and when the 2nd candle forms, it tells a completely different story, it’s bullish. This tells you that the bears are losing steam and that the bulls are gaining strength to potentially move the market price up.
The second bullish candlestick should close somewhere up to the mid-point of the first candlestick.
So when you see the piercing line pattern forming at support levels or in a downtrend market, take note as this is a potential bullish reversal signal so you should be thinking of going long (buying).
6: Shooting Star Candlestick Pattern
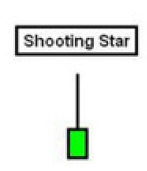 This is one of the most reliable candlesticks and obviously one of the most popular due to the fact that they are so easy to spot on any chart.
The shooting star is single candlestick pattern and when it forms in an uptrend or in a resistance level, then it is considered as a bearish reversal pattern and so you should be looking to sell.
Note: the shooting star is sometimes called the bearish hammer, inverse hammer, inverted hammer or bearish pin bar. They all mean the same and refer to the shooting star candlestick pattern.

7: Hammer Candlestick Pattern
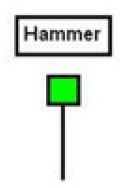 The hammer candlestick is a single candlestick pattern and it is considered a bullish reversal candlestick pattern and it’s the opposite of the shooting star candlestick pattern.
It has a very long tail and a short upper wick or none at all. When it forms in a downtrend or at support levels, you should take note…this is a very high probability bullish reversal candlestick pattern and you should be looking to go long (buy).
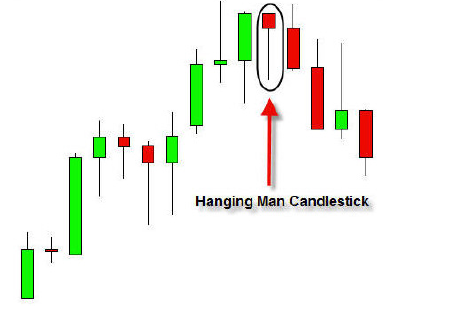
8: Hanging Man Candlestick Pattern
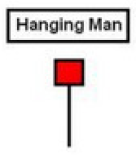 Now, what happens if you see in an uptrend a candlestick that looks like a hammer? Is it still a bullish signal? Well, in that case, this candlestick is a hanging man and it’s not a bullish signal. Here’s how it looks:
Now, the hanging man is exactly like a hammer but the only difference is that it must form in an uptrend.
When it forms in an uptrend or in resistance levels, it tells you that there is a possibility that the uptrend is ending so you should be looking to go short (sell). See chart below:
9: Railway Track Candlestick Patterns
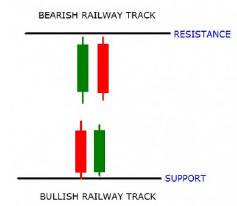 The railway track pattern is a 2-candlestick pattern and there’s a bearish and bullish railway track candlestick pattern.
A notable feature of railway tracks is that they look like parallel railway tracks…and both candlesticks should be of almost the same length and body and almost look like a mirror image of each other.
For a bearish railway track, the first candle is bullish followed by almost exactly the same length and body of the second candlestick which is bullish. This tells you that bulls are losing ground and bears have gained control.
So when you see the bearish railway track pattern in an uptrend, or in an area of resistance, this is a signal that the downtrend may be starting so you should be looking to sell.
Similarly but the opposite is the bullish railway track pattern. When you see this in a downtrend or in an area of support, take note because the market may be heading up and this is your signal to

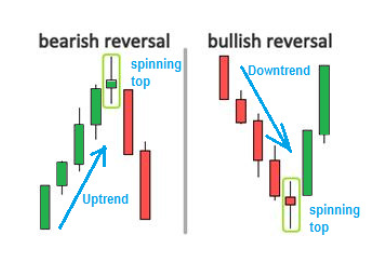
10: Spinning Top
Spinning tops can be continuation candlestick patterns or reversal candlestick patterns. Spinning tops have small bodies with upper and lower shadows that exceed the length of the body. Spinning tops signal indecision. A spinning top
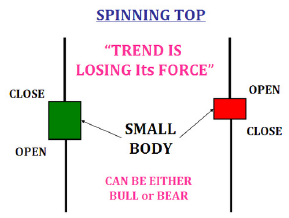
is a single candlestick pattern and it can be both bullish or bearish.
Let me explain. If you see are bearish spinning top in a support area or in a
downtrend, this can be considered a bullish reversal signal when the high of that bearish spinning top is broken to the upside.
Similarly, a bullish spinning stop in a resistance level or in an uptrend can be considered a bearish signal as soon as the low is broken to the downside.
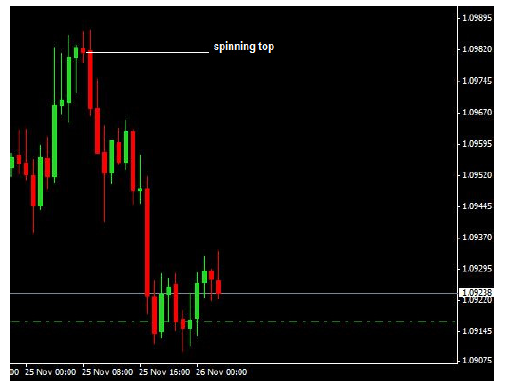
The example below shows what I mean:
Spinning tops are fairly short in length compared to other candlesticks and their body length is a few steps wider than that of doji candlesticks(which actually have none or very tiny bodies).
Another notable feature of spinning tops is that the wicks on both sides should be almost the same length.
When I see spinning tops form on support or resistance levels, all it tells me the bears and bulls do not really know where to push the market and so when a breakout of the low or high of a spinning top by the next candle that forms usually signals the move in that direction of breakout!
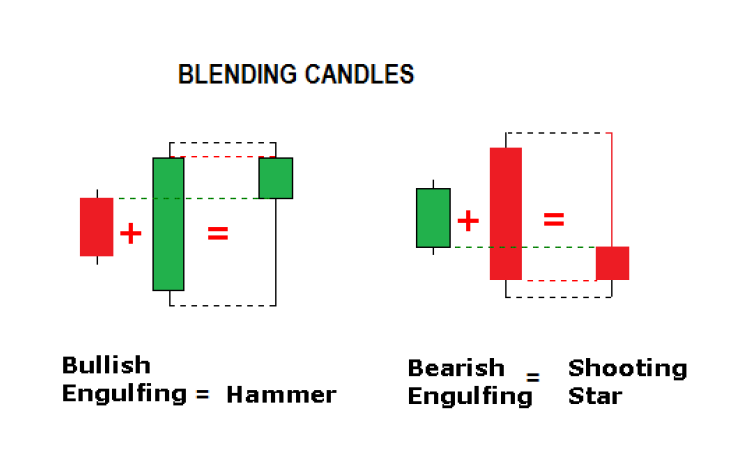
Blending Candlesticks-A Concept Every Trader Needs To Know
This is a technique where not many traders are aware of and I will just give you a simple example so you understand this concept better.
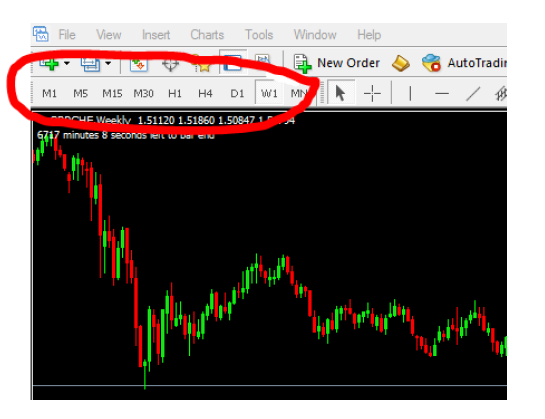
To give you a bit of context, if you are a forex trader and you are using the metrader4 trading platform, it got only 9 timeframes where your charts can be viewed in which are the 1m, 5min, 15m, 30min, 1hr, 4hr, daily, weekly & monthly timeframes as shown on the chart below:
You may see a hammer in the 1hr timeframe but remember that that 1hr timeframe has two-30minute candles to make 1 hr, right? Yes.
So what do you think the candlestick pattern would be in the two-30 minute candlesticks to give you a bullish hammer candlestick pattern in the 1hr timeframe?
Or if you see a shooting star bearish candlestick in the 1hr timeframe, what do you think would be the candlestick pattern in the two-30minute candlesticks that gave that 1hr candlestick a shooting star?
Well, your answers are below:
ope you really understand this concept because here’s why:
In the metatrader4 trading platform, there’s no partner timeframe for 1minute…you need a 2minute chart which does not exist. Similarly, there’s no 10min chart which you can use to blend with the existing 5min timeframe. Similarly, there is no 2hr timeframe to go with the 4hr timeframe and no 8hr timeframe to go with the existing 4hr timeframe.
So let’s say you are a trader that loves to trade only hammers and shooting stars and you are waiting for buy at a major support line in the 1hr timeframe.
You’ve been waiting patiently for a bullish hammer candlestick pattern to form to give you the signal to buy.
But unfortunately, no hammer forms in the 1hr timeframe and even though you see a bullish engulfing pattern formed, you did not enter a buy trade.

You just watched as price shoots up and you wished you could have bought at the bullish engulfing signal that was given but you are only interested in trading hammers.
Well, if there was a 2hr time frame in metrader4, you could have switched to it and seen a very bullish hammer and you could have taken the trade but because you did not understand the concept of blending candlesticks you missed a very good trade!!!
Here are a few more examples:
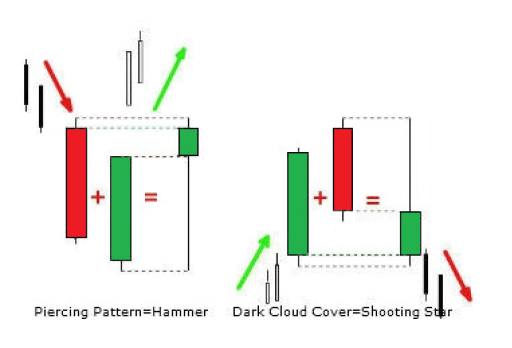
Notice also that a piercing line pattern when blended forms a hammer.
A Dark cloud cover when blended also forms a shooting star.
Now you have a good understanding of reversals & continuation candlestick patterns you may ask ‘Which candlestick pattern is most reliable?’. My response would be that you need to give yourself time to trade these patterns on demo and choose for yourself.
You should also practice them across different timeframes so you can decide the timeframe for yourself. Backtesting also helps in this regard.
Double Bottom and Top Chart Pattern
Triangle chart patterns-symmetrical, ascending and descending
Head & Shoulders Chart Pattern
CLICK HERE TO GO BACK TO THE PRICE ACTION COURSE TOPIC LIST
Top 3 reasons why it is so important for you to know reversal points/levels as well as understand trend continuity patterns and signals:
- You don’t want to be buying near or at a resistance level (which is a reversal point).
- You don’t want to be selling at near or at a support level (which is a reversal point).
- You don’t want be buying when the trend is down and you don’t want to be selling when the trend is up that’s why you need to know about continuation charts and candlestick patterns which will allow you to trade with the trend. (There are exceptions though when you can trade against the main trend like that like in trading channels and we will look at that in detail in a few chapters of this course)

You will also need to know about candlestick patterns that are associated with reversals like pin bars.
These reversals & continuation candlestick patterns are also useful in synthetic indices trading. You can use them with these strategies:
- V 75 Scalping Strategy
- 3 Pips Synthetic Indices Strategy
- The Powerful V75 Moving Average Buy-Only Strategy
You can also download and use the free Candlestick Pattern Indicator For Trading Reversals. The indicator will identify reversal candlestick patterns for you.
As always, please do not forget to share this with your friends using the buttons below.
Other Posts You May Be Interested In
The Best Forex Demo Contests (Updated 2024)
Below is a list of the best and current forex demo account contests. Broker [...]
Brokers Offering Copy & Social Trading
Are you looking for the best list of copy trading platforms? Then look no further [...]
What Is An Islamic Forex Account?
What Is An Islamic Forex Account? An Islamic, or ḥalāl forex trading account is a [...]
1. Introduction To Price Action
What Is Price Action Trading? Price action is the study of a forex pair’s price [...]
FBS Broker Review. All You Need To Know ☑️ (2024)
FBS is an online broker that offers financial market trading in forex and CFDs. This [...]
Understanding Candlesticks In Trading
The candlestick chart is the most common among traders. The candlestick chart had its origins [...]