How To Instal MT4 Indicators
This tutorial is for newbies who want to learn how to install mt4 indicators. As you learn forex, you will come across custom indicators which can enhance the usefulness of your MT4 platform. A common challenge is how to install and activate these indicators.
To use these indicators, you first need to open a free forex account.
You can open your forex account using any of the best MT4 brokers below.
| Broker |
Features
|
Links |
|---|---|---|
 |
Min. Deposit: 1 USD
Max. Leverage: 1:30
Trading Platforms: MT4, MT5, FBS trader, CopyTrade
Regulation: CySEC, FSC, FSCA, ASIC
|
Visit FBS
|
 |
Min. Deposit: 5 US$
Max. Leverage: 1:30 | 1:1000
Trading Platforms: MT4, MT5
Regulation: CySEC, FCA, DFSA, FSCA
|
Download MT4 |
 |
Min. Deposit: US$5
Max. Leverage: 1:30 to 1:888
Trading Platforms: MT4, MT5, XM WebTrader
Regulation: CySEC, ASIC, FSC
|
Download MT4 |
 |
Min. Deposit: US$1
Max. Leverage: 1:1000
Trading Platforms: MT4, MT5, WebTrader, InstaTick Trader
Regulation: CySEC, BVI, SVGFSA
|
Visit Instaforex |
 |
Min. Deposit: US$1
Max. Leverage: 1:1000
Trading Platforms: MT4, CopyTrader
Regulation: IFSC
|
Download MT4 |
Download the MT4 platform for the broker you have chosen above. After doing that follow these steps and easily install your MT4 indicator.
Step 1: Download The MT4 Indicator To Your Computer
Many times, when you click to download a custom mt4 indicator, by default, it will automatically download to the “Downloads” folder on your computer.
But if you click to download and a box pops up asking you where to save it, then save it to the desktop.
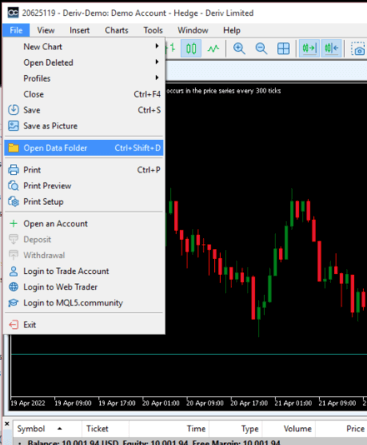
Step 2: Go To Your Mt4 Trading Platform And Click “Open Data Folder”
You will find this under ‘File‘ in the top left corner of your MT4 platform
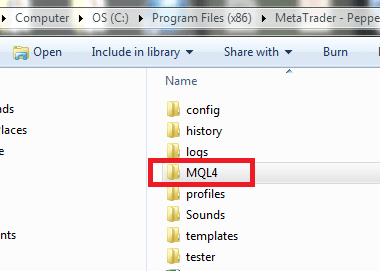
Step 3: Click to Open the “MQL4” folder
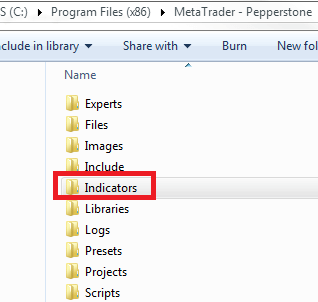
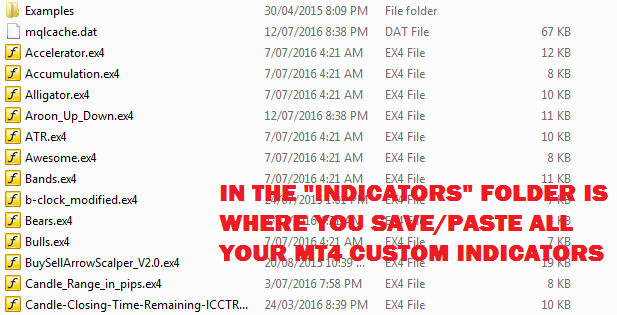
Step 4: Click Open the “MT4 Indicators” Folder
Step 5: Paste The Custom MT4 Indicator Into The “Indicators” Folder
Step 6: Close & Restart Your MT4 Trading Platform And Then It
After you’ve saved your custom mt4 indicator in its appropriate “indicators” folder, you need to restart your MT4 trading platform.
If you’ve never used the MT4 trading platform previously and don’t know what to do, the first thing is you need to open up your Metatrader 4 chart.
By default, when you download your metatrader4 trading platform from the brokers’ website, it will create an icon on your computer’s desktop.
Click on that icon and then your mt4 chart will open up.
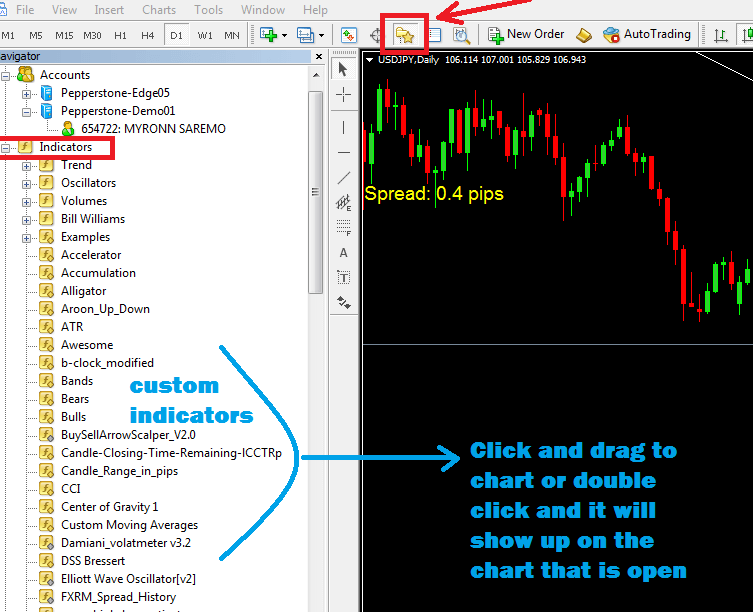
Once your chart is open, click on the icon at the top of the window. A list of all the mt4 indicators available will appear. You can put the mt4 indicator on the chart by either dragging it or by double-clicking it.
List Of Free Mt4 Indicators
Candlestick Pattern Indicator For Trading Reversals
Reversal candlestick patterns are an excellent way to enter or exit a trade. There are quite a few candlestick patterns you can use and the best way to find them is to use a candlestick pattern indicator which you can download below.
You don’t want to miss any important reversal candle chart pattern and using pattern recognition software is one way to help ensure you are on top of any trading opportunities.
This candlestick pattern recognition indicator for MetaTrader will show you:
- Bullish patterns
- Bearish patterns
- With price action understanding, you will even spot potential breakout trading patterns which can get you on a solid trend.
The candlestick pattern recognition MT4 indicator you can download below will show 10 chart patterns for bullish and bearish outlooks:
- Shooting star
- Evening star
- Evening doji star
- Dark cloud pattern
- Bearish engulfing pattern
- Bullish hammer
- Morningstar
- Morning doji star
- Piercing line pattern
- Bullish Engulfing pattern
The meaning of these candlesticks will become clear when you see them on a chart. Keep in mind that candlestick patterns are a legitimate form of technical analysis and you should put some time into learning how to trade with them.
How The Forex Candlestick Pattern MT4 Indicator Works
- Automatically scans the charts no matter which time frame you put it on and it will show you exactly where there are specific candlestick pattern formations such as the Evening Doji Star, Evening Star, Shooting Star, Bearish Engulfing Pattern, Dark Cloud Pattern, etc…
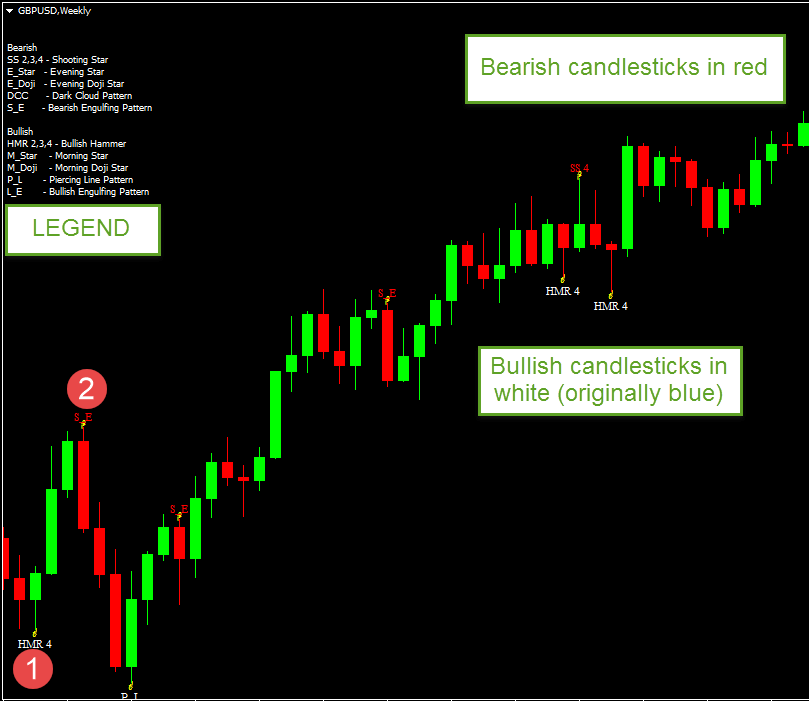
- The candlestick pattern indicator is very easy to interpret by the user because on the top left-hand corner you will see that it has all the key/legend of the candlestick patterns that it can show.
If a specific candlestick forms, it shows some abbreviated letters above or below the pattern and you can interpret these abbreviations through the legend - Any abbreviated letters that form above a candlestick high indicate bearish candlestick patterns and any that form below the low of a candlestick indicates that that specific candlestick is bullish.
This is a weekly chart and only shows 2 different types of candlestick reversal patterns:
- Bullish hammer
- Bearish engulfing
You could actually use these weekly candlesticks to have a bias for the coming week on lower time frame charts. This will be part of your multi-time frame trading.
How To Trade With The Reversal Candlestick Pattern MT4 Indicator?
There are many forex trading strategies on this website where the use of a candlestick as a trade entry confirmation is imperative and will greatly assist you as a forex trader who is just starting out and finding it difficult to tell which candlestick is which.
That’s where the candlestick indicator comes in very handy. You can be trading in any time frame using this candlestick pattern indicator and it will still show any reversal candlestick that forms in the time frame your chart is on.
You don’t have to trade every candle pattern you see and in certain conditions, you’d want to ignore some of the patterns:
- In an uptrend, you’d only want to trade bullish reversal candlestick patterns which the indicator shows
- In a downtrend, you’d only want to trade bearish reversal candlestick patterns
You may want to focus on support and resistance zones for trading any candlestick reversal the indicator shows. These are previous market turning points and could act in that manner again.
The standard trend line trading strategy could also be used as a reversal area and you would only trade if the pattern recognition software plots one of the 10 candlestick patterns
Candlestick Pattern Indicator Download Link
Here’s your download link to the Candlestick pattern indicator called the Pattern Recognition Master
Download the Candlestick Pattern Indicator HereGartley Pattern MT4 Indicator
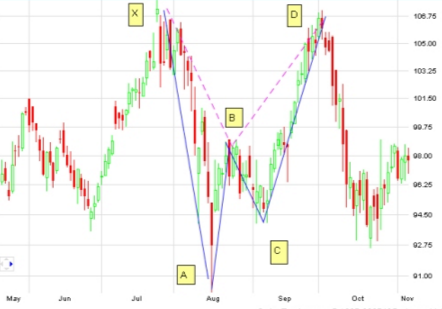
You can use this Gartley Pattern MT4 Indicator, with the Gartley Pattern Forex Trading Strategy.
Trying to work out the Gartley pattern manually is time-consuming and it is not just one thing you are looking for but a lot of other things as well that make up the Gartley Pattern.
Therefore the Gartley pattern indicator is really useful as it eliminates the manual technique.
All you need to do is download the Gartley indicator and upload it on your mt4 charts and that’s pretty much it.
How The Gartley Pattern MT4 Indicator Works
Once you’ve saved the indicator in your Indicators folder, you simply upload it onto your chart.
You really don’t have to do anything like changing settings. The Gartley indicator will give you the buy or sell signal when it spots a Gartley pattern on the chart depending on the time frame you are using.
As you can see on the chart above that a buy signal was generated by the green arrow pointing up.
This Gartley pattern indicator works on all time frames therefore if you don’t see a Gartley pattern indicator on the 1-hour chart then try the 4-hour chart. If you cannot see them on the 4-hour chart then try the daily chart.
Download the Gartley Pattern Indicator HereSwing High Swing Low MT4 Indicator
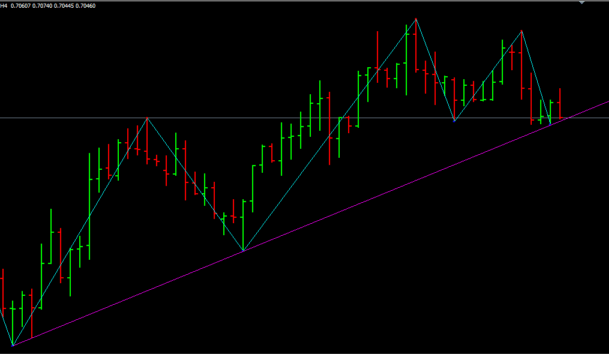
The swing high swing low indicator mt4 shows you the swing highs and swing lows of price action as it moves up and down. It is one of the best MT4 indicators.
This indicator is actually a zigzag indicator and it is a lot better than the default zigzag indicator you would find in your mt4 charts.
From this swing high swing low indicator, you then can identify:
- support and resistance levels.
- draw trendlines
- draw channels
- and even other chart patterns like descending or ascending triangle
How To Draw Trendlines With The Swing High Swing Low Indicator
MT4 indicators can help you in a variety of ways. To draw trendlines with the swing high swing low indicator just do the following. In an uptrend, you need a minimum of 2 green dots and you can draw a trendline, like this:
Do the opposite for drawing trendlines in downtrends.
You can also use the swing high low indicator to draw:
- upward price channels
- downward price channels
- sideways price channels
Support And Resistance MT4 Indicators
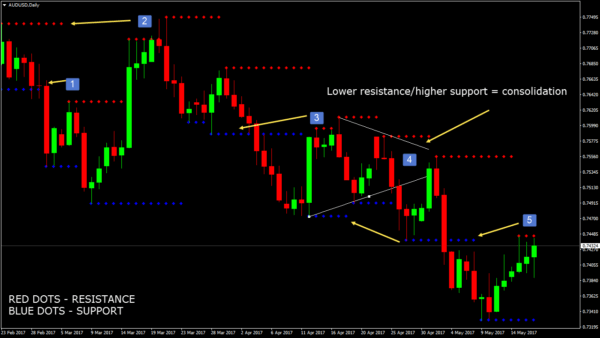
Support and resistance is one of the oldest technical analysis methods that traders use whether as a Forex trader, Futures trader, or any other market.
Whether a horizontal support and resistance indicator is used or they are manually plotted, they are often pivot points in the market and traders should be aware of them.
Using Price High and Low for Support and Resistance
It is fairly straightforward when plotting horizontal support and resistance level lines. Most traders will use turning points in the market which are easily visible on any chart. While not an exact science, this is an easy way to gain some perspective on your chosen market.
Since many traders scan many instruments, the use of a support and resistance indicator can speed up the process during your scan. The Forex market has so many currency pairs you can trade that it can be extremely time-consuming to manually plot these lines.
Candle Closing Time Remaining indicator
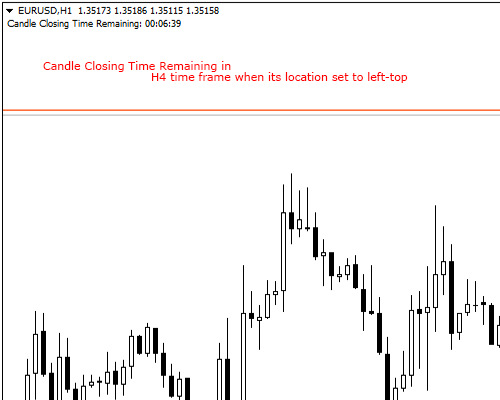
The Candle Closing Time Remaining (CCTR) is one of the most useful MT4 indicators which displays the remaining time for an open candle to be closed.
How To Use The Candle Closing Time Remaining indicator
You can change the location of display time, by setting the “location” Input field as follows:
– set location ‘Top-Left’: To be displayed in a comment in the top-left part of the chart.
– set location ‘Top-Right’: To be displayed in the top-right part of the chart.
– set location ‘Bottom-Left’: To be displayed in the bottom-left part of the chart.
– set location ‘Bottom-Right’: To be displayed in the bottom-right part of the chart.
– You can choose to show or not to show server time displaying by setting “displayServerTime” as follows: [v2]
– set ‘On’: display server time.
– set ‘Off’: don’t display server time.
You can turn on or off the alert sound playing by setting “playAlert” as follows: [v3]
– set ‘On’: play a sound when the candle is going to close in less than 5 seconds.
– set ‘Off’: don’t play sound.
Also, you can set your favourite sound as an alert by entering its name on “customAlertSound”: [v3]
– note that the file must be located in terminal_directory\Sounds or its sub-directory. Only WAV files are played.
– if you leave the field empty, the default sound will be played.
That is the list of MT4 indicators we currently have. Do you want us to add more? Share your thoughts in the comments below.










Other Posts You May Be Interested In
Bullish Engulfing Pattern Forex Trading Strategy
One important skill as a forex trader is the ability to spot reversal patterns when [...]
What Is An Islamic Forex Account?
What Is An Islamic Forex Account? An Islamic, or ḥalāl forex trading account is a [...]
List Of MT4 Indicators & How To Install Them
Indicators, if used correctly, can help simplify your forex, binary options and synthetic indices trading. [...]
HFM Broker Review (2024) ☑️ Is It Trsutworthy?
HFM Overview HFM, previously known as Hotforex was founded in 2010 and has its headquarters [...]
1. Introduction To Price Action
What Is Price Action Trading? Price action is the study of a forex pair’s price [...]
Day Trading
What Is Day Trading? This is the definition of day trading in the context of [...]