Explore The Chapters
8. Profitable Chart Patterns Every Trader Needs To Know
9. How To Trade Fibonacci With Price Action
10. How To Trade Trendlines With Price Action
11. How To Trade Moving Averages With Price Action
12. How To Trade Confluence With Price Action
13. Multiple Time Frame Trading
15. Precautions & Conclusion With Price Action Trading
Many new traders that find it difficult to define the structure of a trending market, therefore they rely on moving averages for trend detection or identification.
Using Moving Averages For Dynamic Support And Resistance Levels
The concept of dynamic support and resistance can be fully understood with a few charts given below.
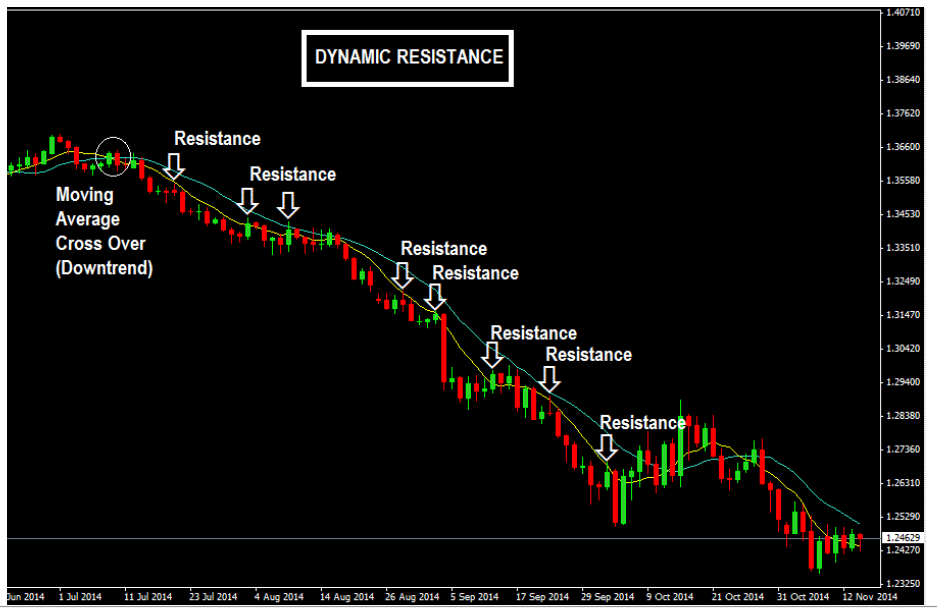
When the market is in a downtrend, you will notice that price moves up to the moving average lines (upswing) and then bounces back down from them (downswing). (That is if you put moving average lines on your charts).
Here’s an example:

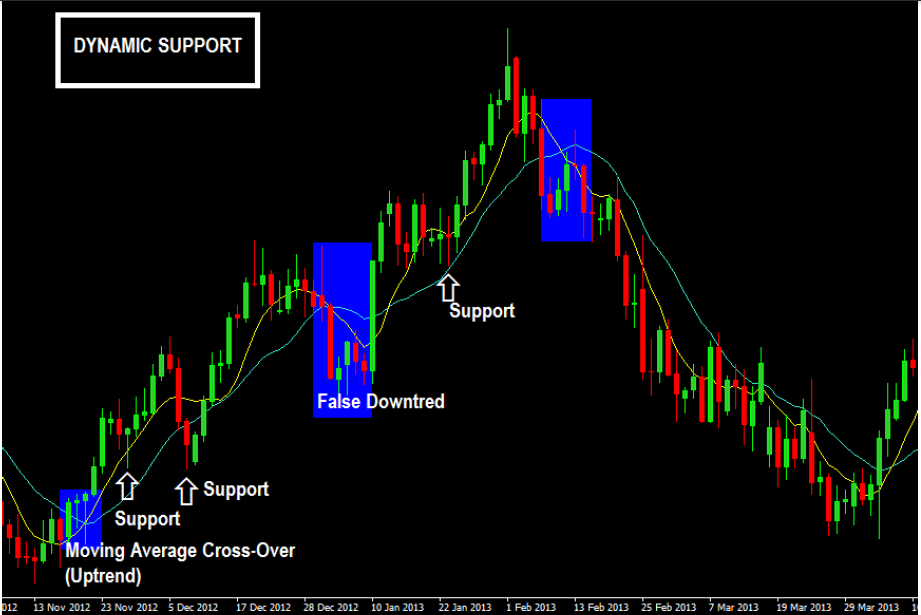
The similar situation happens in an uptrend: prices move down to the moving average lines (downswing) and then bounces up from them (upswing).
Here’s an example shown on the chart below:
Now that you know this concept of dynamic support and resistance using moving averages, the next thing you need to know is that trend trading strategies can be created around them and in a very nice trending market, they are really effective.
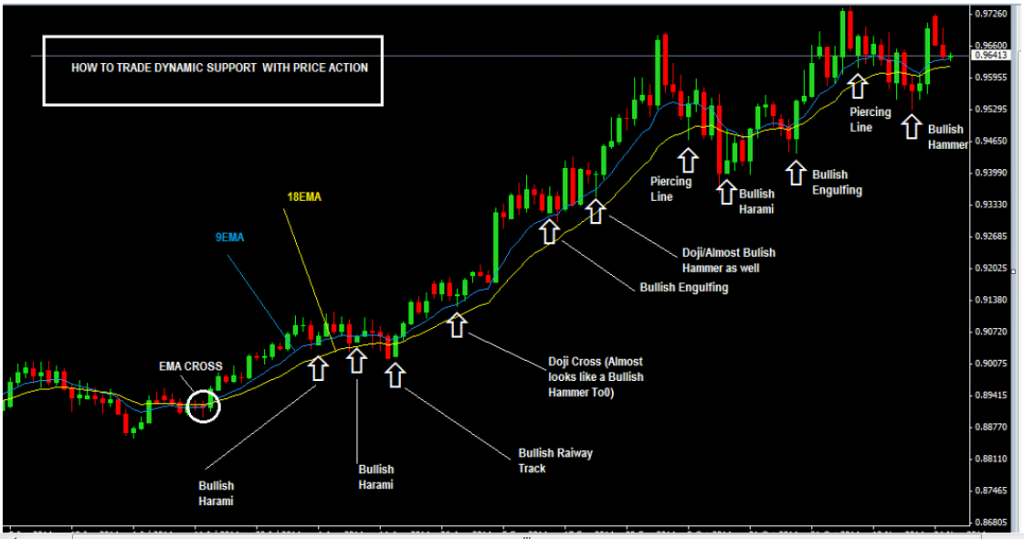
For those that love moving averages, look for reversal candlesticks as the price starts to go back to touch the moving average lines and these are used as your confirmation signal to buy or sell.
- In a downtrend, you should be looking for bearish reversal candlesticks like the shooting star, bearish harami, spinning tops, dark cloud cover, hanging man etc to go short (sell).
- In an uptrend, you should be looking out for bullish reversal candlestick patterns like pin bars, dojis, piercing line, bullish harami etc…
Let’s study the past again…on the chart below is an example of how to trade dynamic support with Price Action:
Now, it’s easy to say here that “ you could have bought here and sold here” etc based on what happened in the past because now you can see how the market has played out in the past…
But real challenge for many traders is that when a setup is happening, they will most likely second guess it because this is how its going to look:
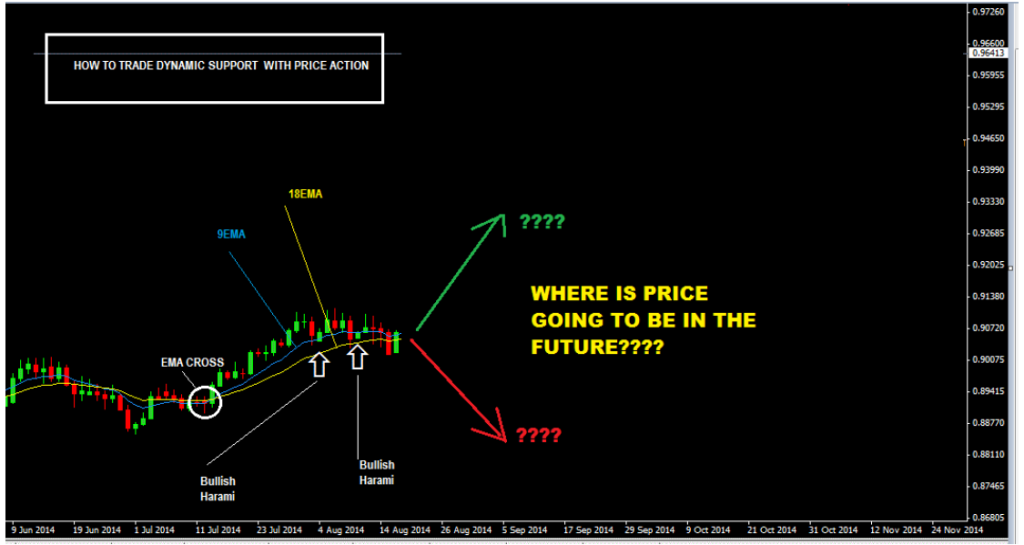
And this is how how it turned out:
This is how you can use trading averages together with price action in forex and synthetic indices trading.
Explore The Chapters In The Price Action Course
Share this using the buttons below
Other Posts You May Be Interested In
1. Introduction To Price Action
What Is Price Action Trading? Price action is the study of a forex pair’s price [...]
Bullish Engulfing Pattern Forex Trading Strategy
One important skill as a forex trader is the ability to spot reversal patterns when [...]
How To Trade Synthetic Indices: A Comprehensive Guide For 2024
Synthetic Indices have been traded for over 10 years with a proven track record for [...]
Why You Should Be Trading Price Action?
Price action represents collective human behaviour. Human behaviour in the market creates some specific [...]
MT4 Order Types
There are different MT4 order types like buy stop, sell stop, sell limit, buy limit, [...]
How To Trade Fibonacci With Price Action
Fibonacci retracement levels were discovered by an Italian mathematician by the name of Leonardo Fibonacci [...]