What is Multi-timeframe Analysis Multiple time frame trading is the process of analysing the same currency pair under different time frames eg 30 min, 1 hr, 4 hr and daily charts. The larger time frame is used to establish a longer-term, dominant trend, while a shorter time frame is used to spot ideal entries into […]
Category Archives: Price Action Trading
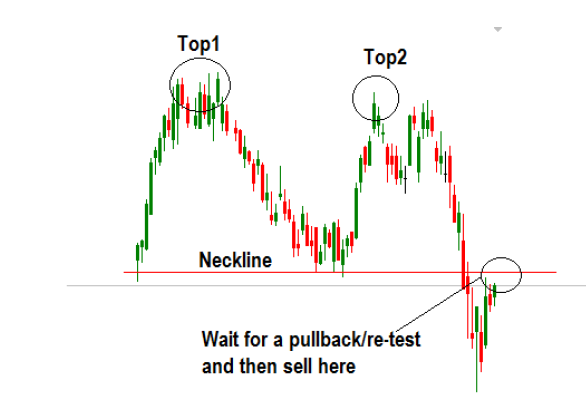
There’s a difference between chart patterns and candlestick patterns. Chart patterns are not candlestick patterns and candlestick patterns are not chart patterns: Chart patterns are geometric shapes found in the price data that can help a trader understand the price action, as well as make predictions about where the price is likely to go. Candlestick patterns, on the other hand, can involve only […]
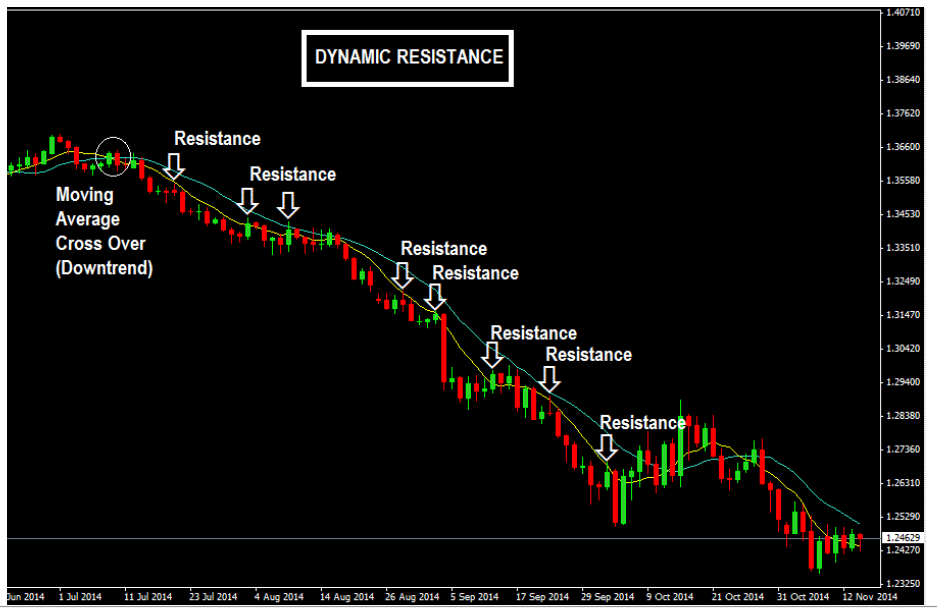
Many new traders that find it difficult to define the structure of a trending market, therefore they rely on moving averages for trend detection or identification. Using Moving Averages For Dynamic Support And Resistance Levels The concept of dynamic support and resistance can be fully understood with a few charts given below. When the market […]
Confluence refers to a junction of two or more items. For example, the place where two rivers meet is called a confluence. In price action trading, confluence refers to a point where two factors come together confirming the same setup or trade idea. For example, what if you were watching the market and then you […]
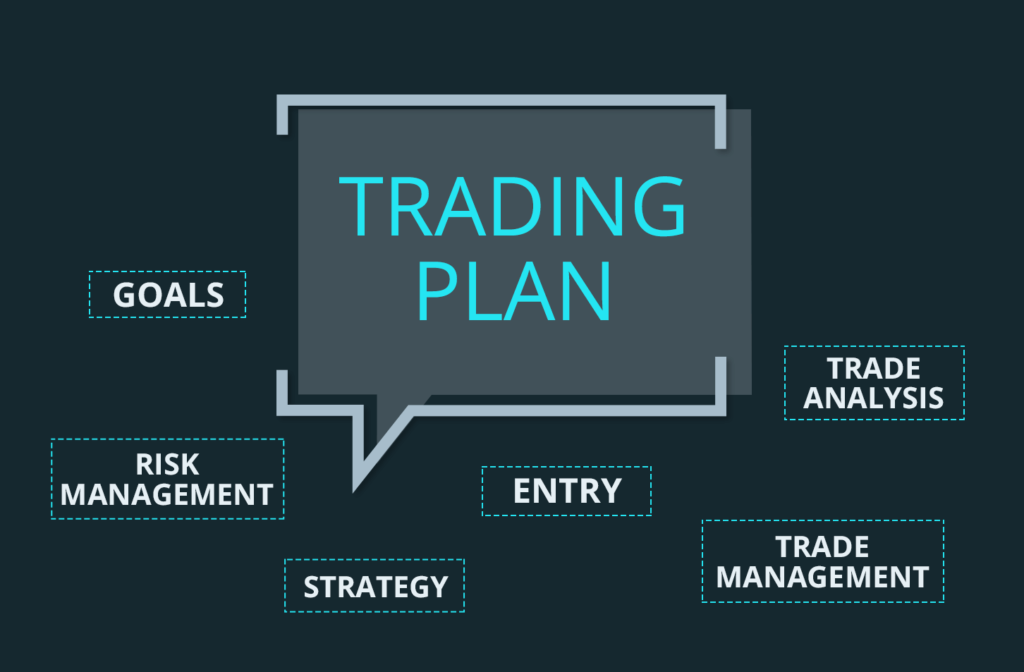
Trading is a risky business, so you need to plan to manage the inherent uncertainty of the markets You need to structure your trading business in the same you would a typical business. As the adage goes, if you fail to plan, then plan to fail. Trading is a risky business, so this adage is […]
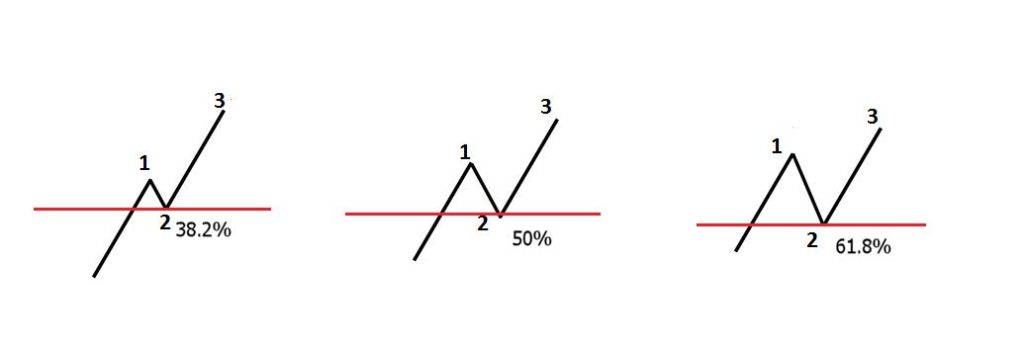
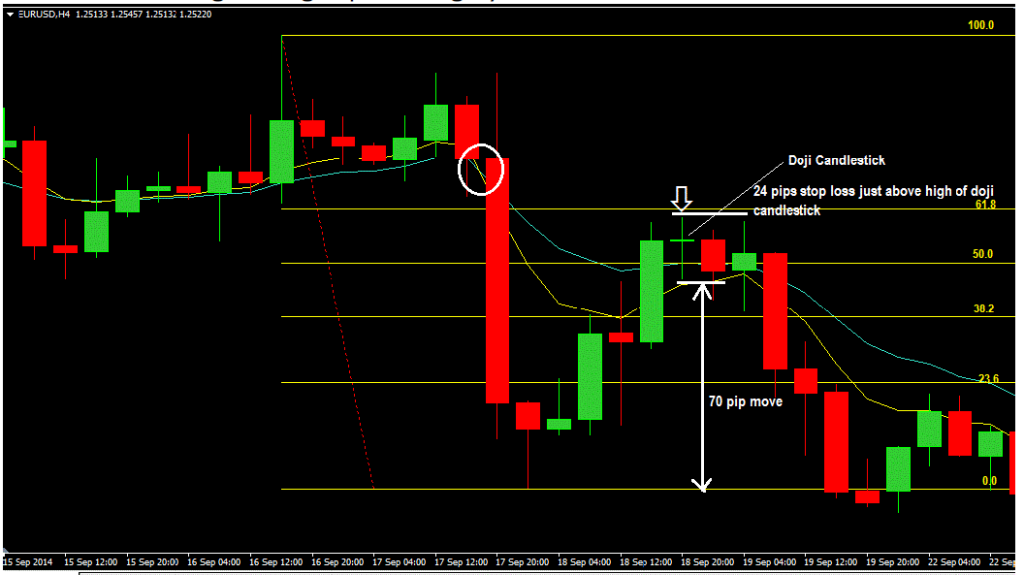
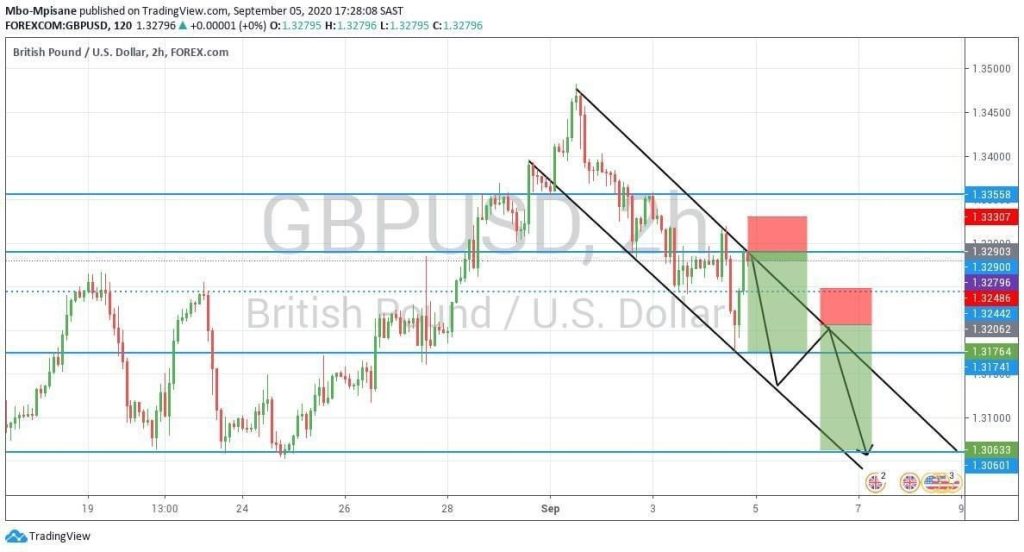
Fibonacci retracement levels were discovered by an Italian mathematician by the name of Leonardo Fibonacci in the thirteenth century. Leonardo Fibonacci had his “Aha!” moment when he discovered that a simple series of numbers that created ratios could be used to describe the natural proportions of things in the universe. Many traders don’t realize that […]
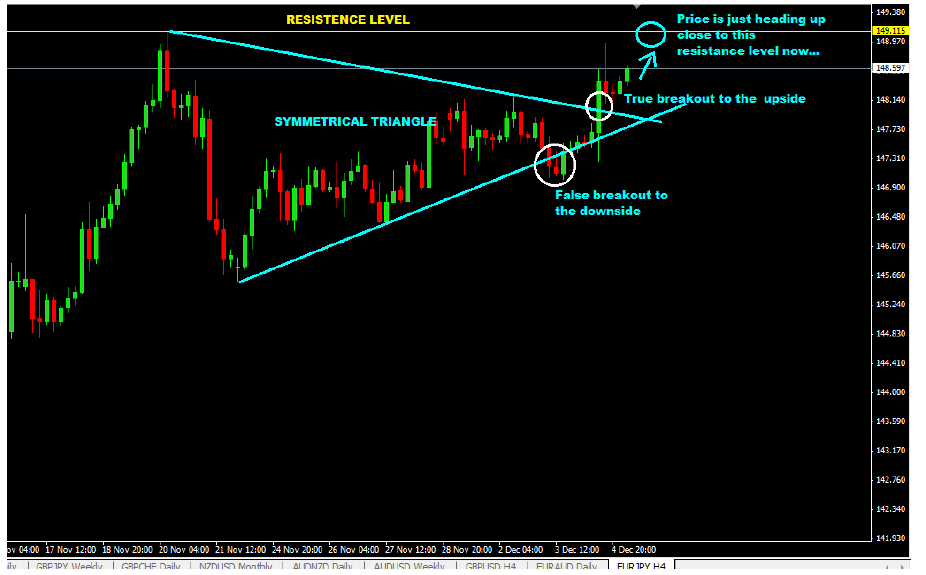
Nothing is more noticeable on any chart than support and resistance levels. These levels stand out and are so easy for everyone to see! Why? Because they are so obvious. As a matter of fact, support and resistance trading is the core of price action trading. Even synthetic indices charts show clear support and resistance levels. The key […]
What is a trending market? It is a market with a strong bias towards one general direction either up or down Trending markets are of particular interest to us as swing traders If you ride a trend well you can hold the position for an extended time until you get reversal signals We have short-term […]
- 1
- 2