WHAT IS CURRENCY CORRELATION?
Currency correlation is a behaviour exhibited by certain currency pairs that either move in the same direction (positively co-related) or in opposite directions (negatively-correlated) at the same time:
- a currency pair is said to be showing a positive correlation when two or more currency pairs move in the same direction at the same time. For example, EURUSD & GBPUSD do these most time. When EURUSD is trading up, you will also see GBPUSD trading up.
- a negative correlation is when two or more currency pairs trade in opposite directions and a good example is EURUSD and USDCHF. When EURUSD is trading up, you will see USDCHF will be falling. They go in opposite directions.
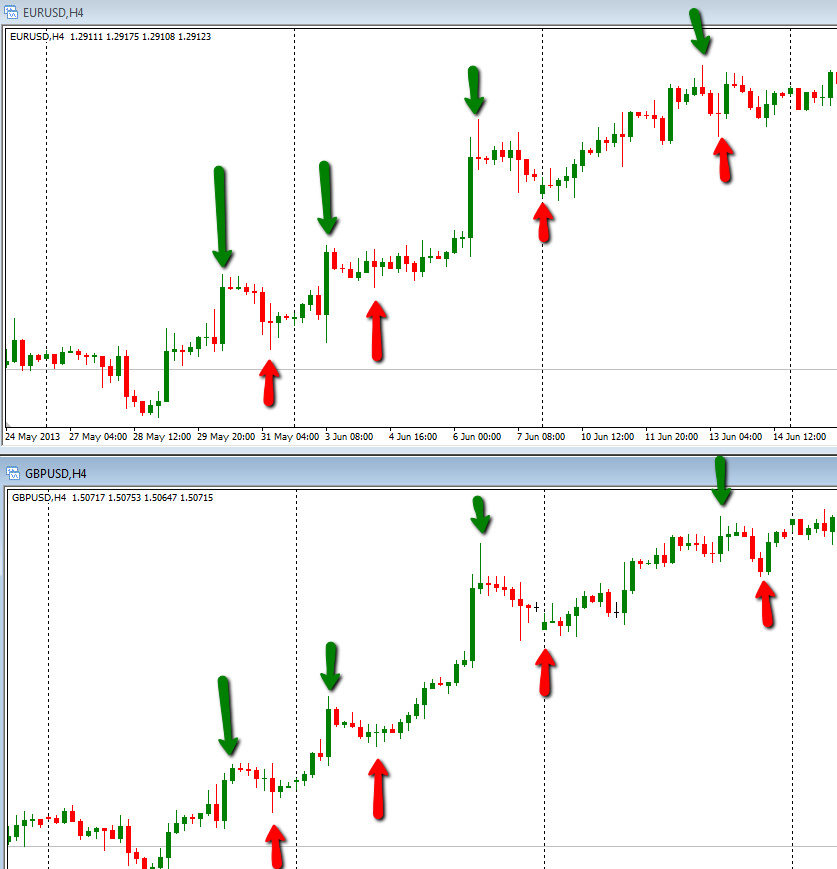
Here is an example of a positive correlation between EURSUD and GBPUSD on the 4hr Timeframe and note the green and red arrows which happen at the same time:
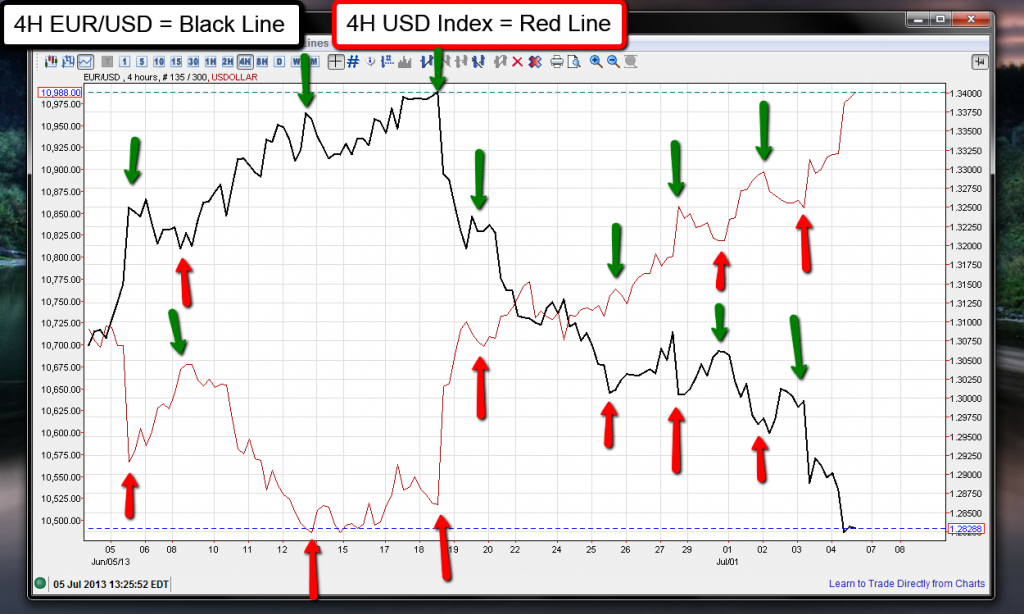
Here’s an example of a negative correlation between EURUSD & USD Index. Note that red and green arrow: when one is going up, the other is going down, that’s negative correlation:
HOW CURRENCY CORRELATION HELPS YOU TRADE PROFITABLY
Knowledge of currency co-relations will ensure that you do not take two positions that go against each other. For example, if you take a buy trade on EURUSD and also same time take a BUY trade on USDCHF without realizing that these two currencies are negatively correlated you will get into this problem:
- one trade on one currency pair will be profitable
- and the other trade will be unprofitable.
Your failure to fully understand the currency correlation will leave you with a trade you should not have taken in the first place. This mistake is usually made by newbie forex traders.
FOREX CORRELATION STRATEGY RULES
Currency Pairs: Only for positively correlated currency pairs like EURUSD and GBPUSD.
Timeframes: 15 minutes and above, lower time frames are not really reliable.
Additional Information: When two positively correlated pairs fall out of correlation at a major support or resistance level we can expect a reversal. This reversal may be as small as 25 pips but more often than not it results in larger moves. So you should be watching these kinds of setups to happen around support and resistance levels.
Now, the setup shown here is based on a support level so its a BUY setup. If this happens on the resistance level, it will be a SELL setup, the exact opposite.
BUY SETUP
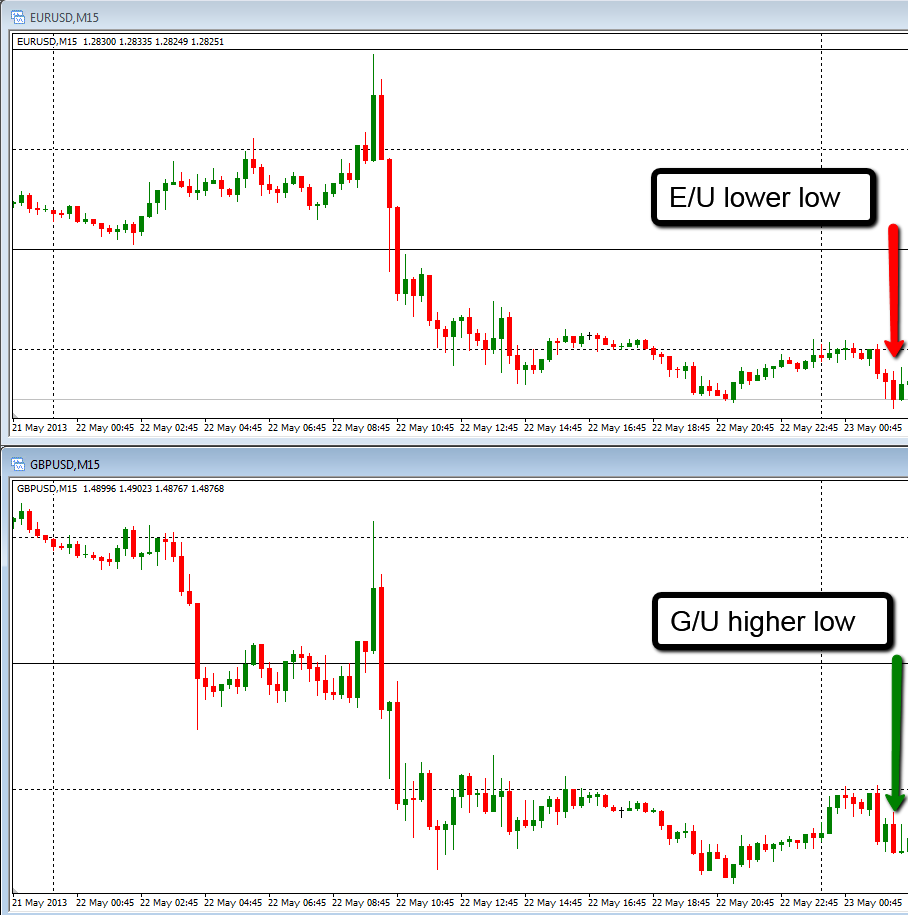
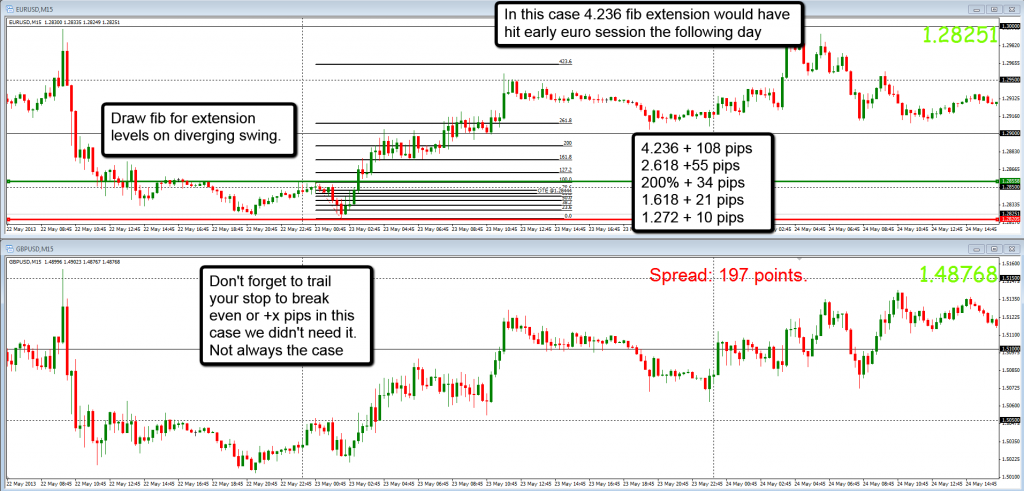
Step 1: EUR/USD made a lower low while GBP/USD has failed to do so.
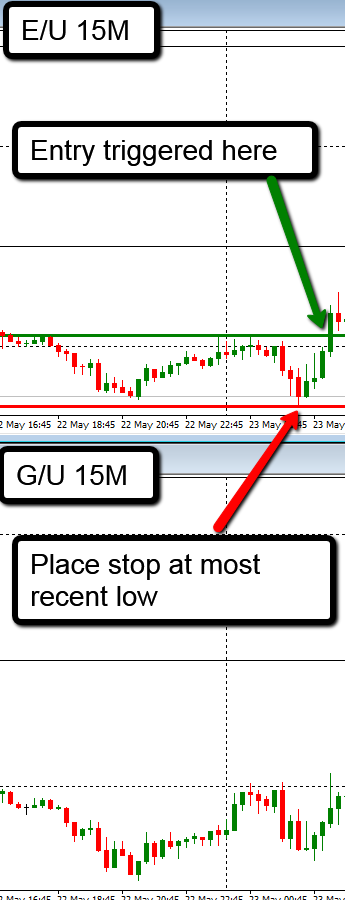
Step 2: Wait for a retest of the divergence swing. No retest occurs so we set a limit order for a breakout trade.
Step 3: Entry is triggered. If you haven’t done so place a stop loss at the most recent swing low.
Step 4: Draw a fib on the diverging swing for profit levels. Don’t forget to trail your stop to break even. In this case, the risk was 35 pips so trail to break even at 25-30 pips. As you can see in this case all fib extensions were hit for a profit of 108 pips. Let’s say you didn’t want to hold a position overnight so you got out when price started to consolidate after the strong up move. You would have made +75 pips.




Other Posts You May Be Interested In
FBS Broker Review. All You Need To Know ☑️ (2024)
FBS is an online broker that offers financial market trading in forex and CFDs. This [...]
List Of Forex Brokers That Accept Airtm (2024)
AirTm has become one of the preferred methods to fund and withdraw from trading accounts [...]
Iq Option Broker Review
Iq option was originally founded as a binary options broker in 2013. The broker has [...]
How To Verify Your Deriv Account
You can trade and withdraw on Deriv without verifying your account but you will face [...]
XM Broker Review (2024): Is XM a Good Broker? ☑️
Overall, this XM can be summerised as a dependable and secure broker, backed by an [...]
How To Transfer Funds From One Deriv Account To Another
It is now possible to transfer funds between two Deriv accounts belonging to two different traders [...]