Week 26/22 Forecast
Where art thou bound, DXY?
This is a very short-form analysis that solely looks at DXY (Dollar index).
I believe that by studying how DXY may possibly trade, it’s the easiest way for anyone dabbling in the financial markets, with a half-decent grasp of the candlestick charts, to trade XXXUSD & USDXXX pairs seductively.
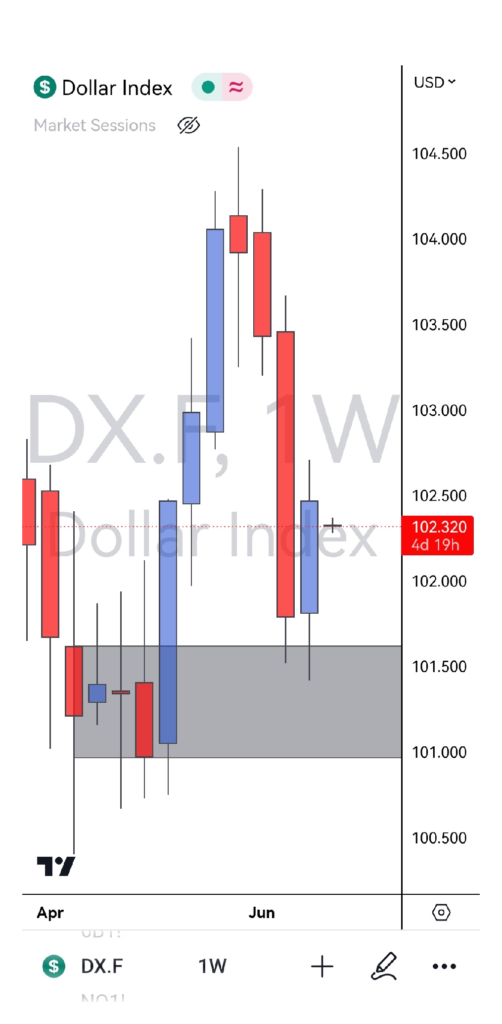
Observe how, since May 31st, DXY has been in a downtrend, selling off from a high of 104.50 to 101.50 which one can argue is an area of Weekly Demand.
For the most part of last week (Week#25), it seems both sides of the market were tussling for dominance as price was pretty much held in consolidation above the 101.50 Demand zone.
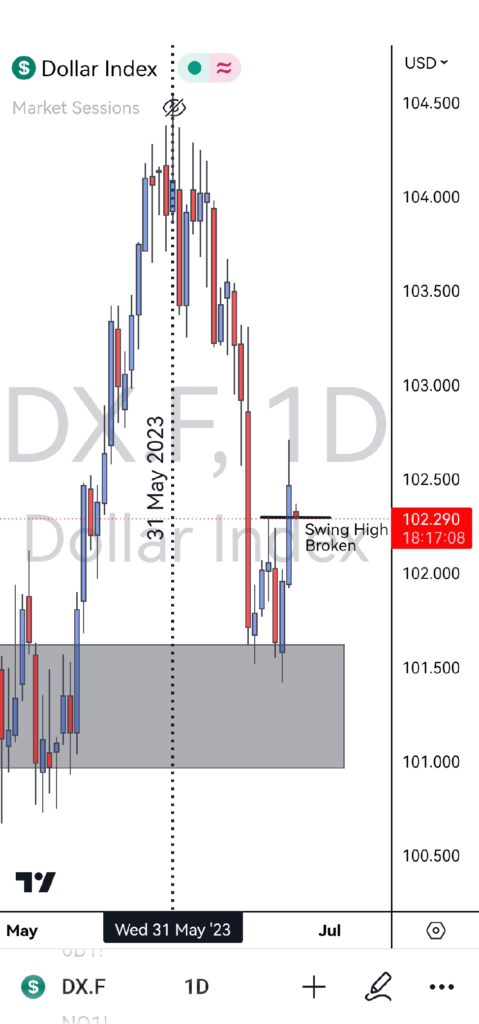
It was only on the final trading day of the week, Friday, when buyers bared their knuckles, quickly shooting price upwards.
This frantic buying caused a Market Structure Break along with a Full Body Daily Candle Close above previous swing high. This configuration, for me, formally ends the 3 week-long downtrend.

Unless we see DXY post fresh daily lows with sellers finding acceptance below 101.50, this price action pattern may be hinting towards a market reversal and the beginning of new downtrends & uptrends in XXXUSD & USDXXX pairs, respectively.
Per usual, I shall be investigating the intraday time frames for confirmation/invalidation of this macro trading plan.

Other Posts You May Be Interested In
Skrill & Neteller No Longer Allowing Deposits To Deriv & Other Brokers
Popular e-wallets Skrill and Neteller have stopped processing deposits and withdrawals to and from Deriv and [...]
Reversals & Continuation Candlestick Patterns
A reversal is a term used to describe when a trend changes (reverses) direction. This [...]
How To Trade Confluence With Price Action
Confluence refers to a junction of two or more items. For example, the place where [...]
Forex Forecast Week 26/23
Week 26/22 Forecast Where art thou bound, DXY? This is a very short-form analysis that [...]
Bullish Engulfing Pattern Forex Trading Strategy
One important skill as a forex trader is the ability to spot reversal patterns when [...]
How To Trade Fibonacci With Price Action
Fibonacci retracement levels were discovered by an Italian mathematician by the name of Leonardo Fibonacci [...]