


Explore The Chapters
8. Profitable Chart Patterns Every Trader Needs To Know
9. How To Trade Fibonacci With Price Action
10. How To Trade Trendlines With Price Action
11. How To Trade Moving Averages With Price Action
12. How To Trade Confluence With Price Action
13. Multiple Time Frame Trading
15. Precautions & Conclusion With Price Action Trading
Confluence refers to a junction of two or more items. For example, the place where two rivers meet is called a confluence.
In price action trading, confluence refers to a point where two factors come together confirming the same setup or trade idea.
For example, what if you were watching the market and then you saw that price is heading to a resistance level and then you checked your Fibonacci retracement and it’s almost like a coincidence that the resistance level is also at 61.8 Fibonacci level.

On top of it, the main trend direction is down.
In this case, there are three things coming together and saying the same thing.
- the overall trend is down (meaning we need to look for selling opportunities)
- you have a resistance level that price is coming to (that resistance level is likely to push price back down continuing with the overall downtrend)
- and you notice that the price is also heading up to the fib level is 61.8 which coincides with the resistance level. (fib levels are common areas of retracement and price can start heading down again after this retracement.)

This is an example of confluence.
A confluence is a point/level in the market where two or more levels intersect each other (or come together) and form a flashpoint or hot point or confluent point on your chart.
Here’s An Example Of How You Can Trade Price Action With Confluence
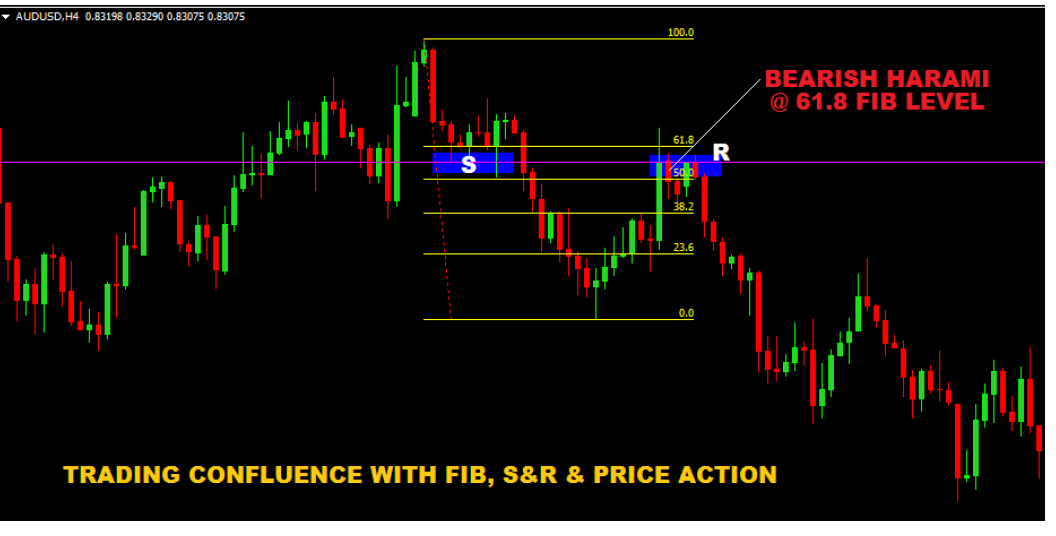
Let us give a real example of a trade that we took as we were writing this. This is the daily chart for AUDUSD. Have a good and close look at it.
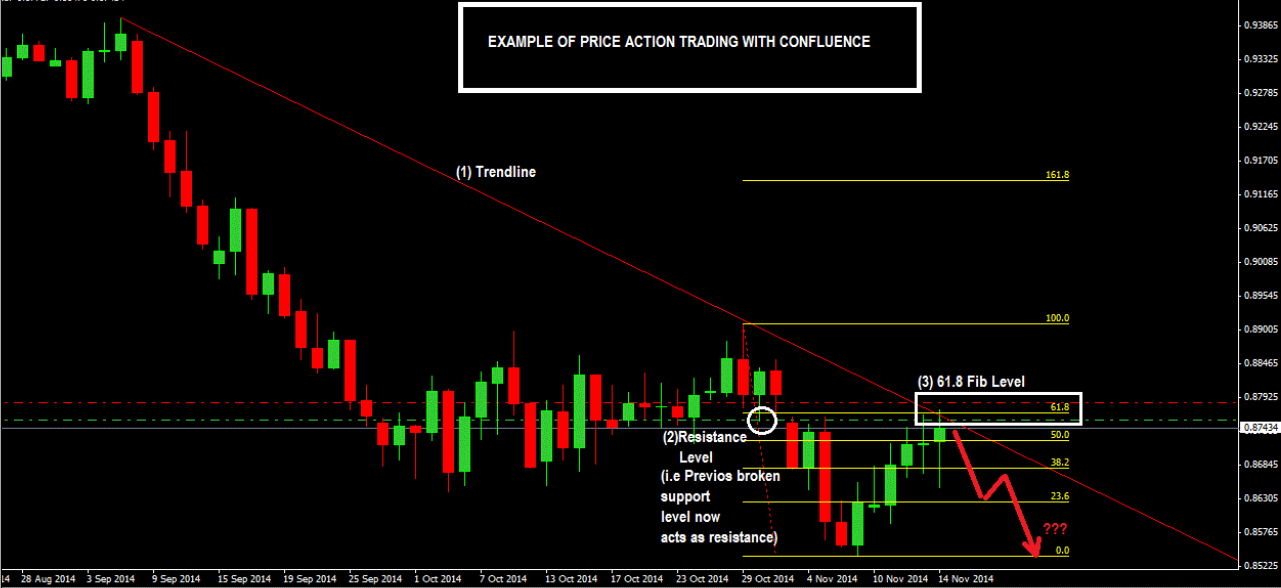
Here’s why we took that trade:
- We first drew a downward trendline and were waiting to see if price would come up to touch the trendline.
- And we also noticed that the previous support level that was broken could potentially act as a resistance level causing price to reverse. Therefore now we have two things coming together.
- Next thing we did was to check the fib retracement level to see what ratio it would be if price came and hit that resistance level. Surprisingly, it was 61.8%.

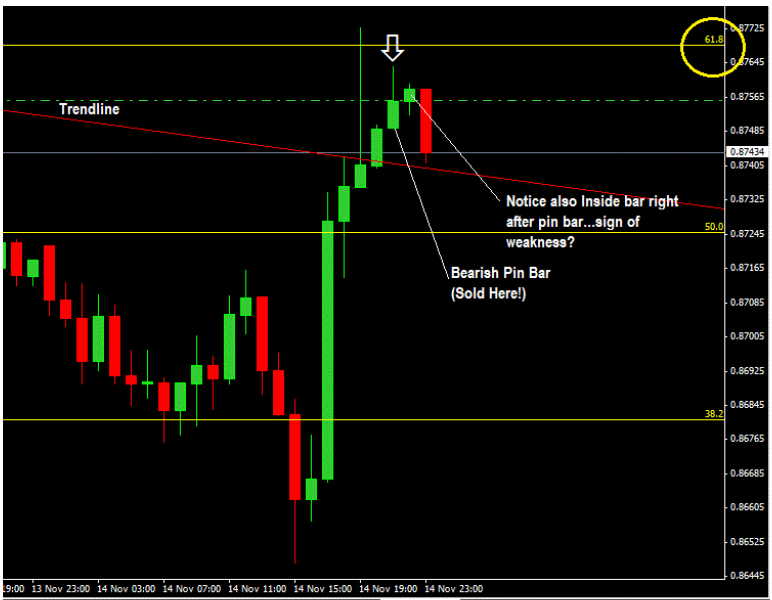
After seeing this confluence we switched to the 1hr timeframe and waited for price to come and hit the confluence zone. This is multi-time frame trading.
There was a bearish pin bar and that was our short trade entry trigger.
Here’s is a close-up of how the trade setup looked like in the 1hr where we were waiting to take the trade(see chart below):
We risked 50 pips for this trade and set the previous swing low as our profit target which is 215 pips away. This gave us a 1:7 risk:reward ratio which is very good.


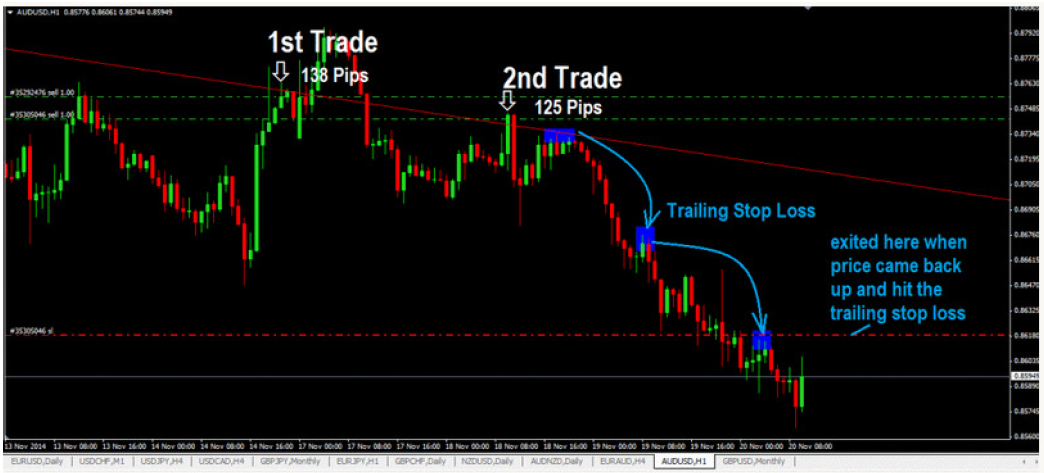
This is how the trade played out.
As you can see, we managed to make 138 pips on the first trade. We also made a 2nd trade entry which made 125 pips.
Even though our profit target was not hit, we used a trailing stop loss as shown below until we got stopped out when price moved back up.
Key takeaways:
- Setups that occur on a confluent level are usually low-risk-high-reward entry trades.
- Such setups have a higher chance of being profitable
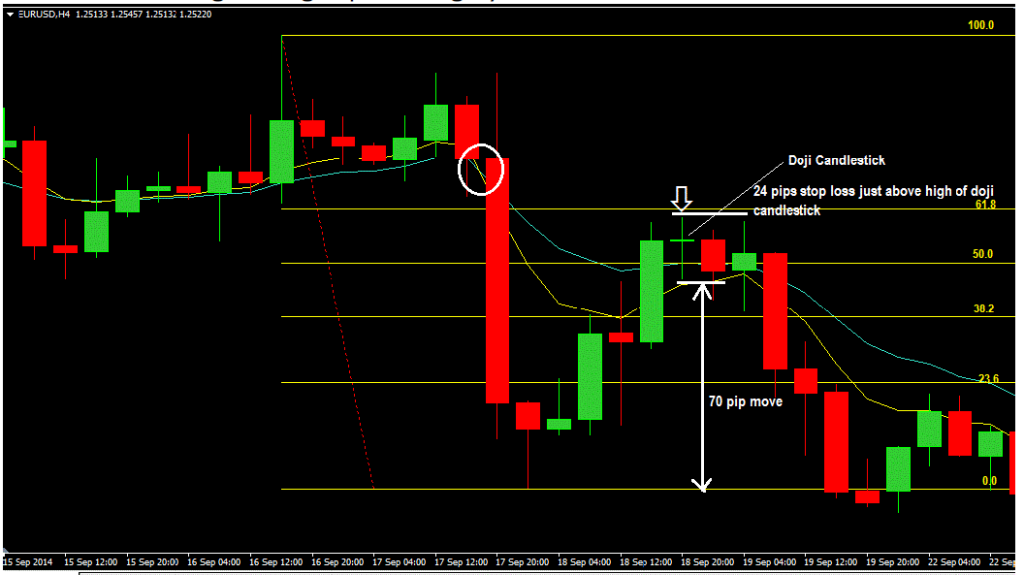
This short trade had 4 confluence factors coming together.
- The doji had confluence with the dominant downtrend, as it formed telling you to sell the market with the trend.
- The doji showed a clear indecision by the sellers and the buyers therefore the breakout of the low of doji candlestick was what the sellers were waiting for to push the market down.
- The doji candlestick also formed between 50-61.8 Fibonacci retracement zone.
- The moving averages were providing dynamic resistance.
Here’s another example:
2 Simple Confluence Trading Price Action Techniques
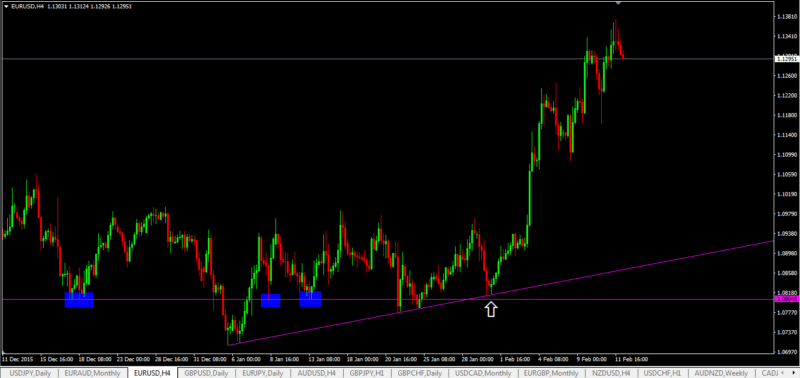
1: Support Level Confluence Trading
With this chart example below, these are the things you should notice right away:
- support levels in blue boxes….
- price has tested support levels on previous occasions and the levels held.
- the rising trendline as well providing another confluence factor to that support level.
- so when price went down again to the zone of that level (white arrow), the trendline was providing support as well as it was in a support level zone as well.
Notice how price shot up after reaching that level.
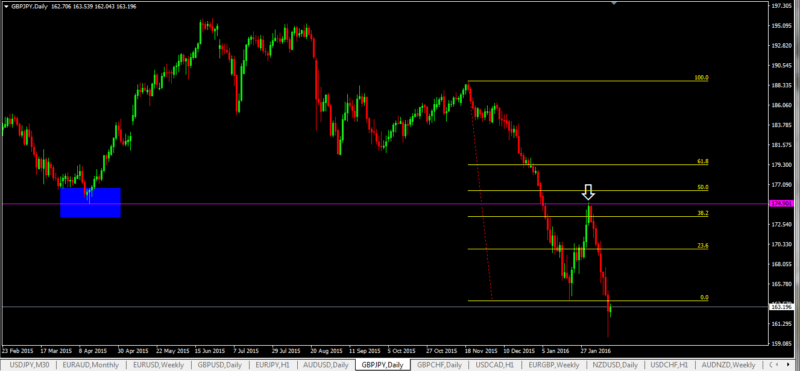
2: Resistance Level Confluence Trading
- In the chart below, notice that there was a support level that was broken (in the blue box) and price was heading up.
- This was a potential support-turned-resistance level coming into play here.
- the confluence trading factor comes into play here when you notice that if you were to draw a Fibonacci retracement level, price actually turned down from the 38.2 fib level
- so what you have here are two things: a resistance level and a Fibonacci level…so two things coming together at a meeting point.
Price falls after reaching this confluence point
Now that you understand confluence, go over your charts and observe what happens in real time.
Try to also see how trading with confluence is very applicable when trading price channels even on synthetic indices.
Explore The Chapters In The Price Action Course
Share this using the buttons below
Other Posts You May Be Interested In
Pin Bar Forex Trading Strategy
The Pin Bar Forex Trading Strategy is a great trading strategy for trend trading: If [...]
List Of MT4 Indicators & How To Install Them
Indicators, if used correctly, can help simplify your forex, binary options and synthetic indices trading. [...]
Heikin Ashi Forex Trading Strategy
Heikin-Ashi candles are a variation of Japanese candlesticks and are very useful when used as [...]
Iq Option Broker Review
Iq option was originally founded as a binary options broker in 2013. The broker has [...]
Why You Should Be Trading Price Action?
Price action represents collective human behaviour. Human behaviour in the market creates some specific [...]
How To Make Money Without Trading As Deriv Affiliate Partner
Do you know you can earn up to 45% lifetime commission on Deriv without placing any [...]