


Explore The Chapters
8. Profitable Chart Patterns Every Trader Needs To Know
9. How To Trade Fibonacci With Price Action
10. How To Trade Trendlines With Price Action
11. How To Trade Moving Averages With Price Action
12. How To Trade Confluence With Price Action
13. Multiple Time Frame Trading
15. Precautions & Conclusion With Price Action Trading
The candlestick chart is the most common among traders. The candlestick chart had its origins in Japan and can also be referred to as the Japanese candlestick chart.
The colour of the candlestick chart tells you if the price was up or down in a particular timeframe which means that candlesticks are either bullish or bearish.
On most charting platforms like mt4 and mt5, you can customise the colours of the candlesticks to your preference.

Now most traders prefer to set green candlesticks as bullish and red candlesticks as bearish. These are the colours that we will be using in our illustrations.
Candlesticks are a critical part of price action trading. They can be used for all financial markets including forex, stocks, cryptocurrencies and synthetic indices.
Components Of A Candlestick
There are three specific points (open, close, wicks) used in the creation of a price candle.
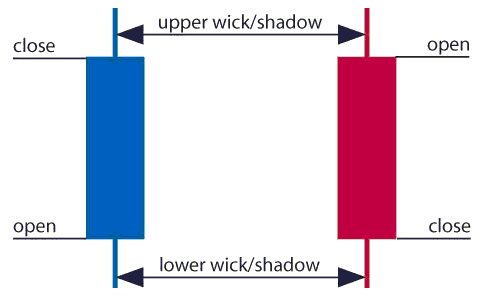
The first points to consider are the candles’ open and close prices.
These points identify where the price of an asset begins and concludes for a selected period and will construct the body of a candle.
Each candle depicts the price movement for a certain period that you choose when you look at the chart. If you are looking at a daily chart each candle will display the open, close, upper and lower wick of that day.
Open price:
The open price depicts the first price traded during the formation of the new candle. If the price starts to trend upward the candle will turn green. If the price declines the candle will turn red.
 High Price:
The top of the upper wick/shadow indicates the highest price traded during the period. If there is no upper wick/shadow it means that the open price or the close price was the highest price traded.
Low Price:
The lowest price traded is either the price at the bottom of the lower wick/shadow and if there is no lower wick/shadow then the lowest price traded is the same as the close price or open price in a bullish candle.
Close Price:
The close price is the last price traded during the period of the candle formation. If the close price is below the open price the candle will turn red as a default in most charting packages.

If the close price is above the open price the candle will be green/blue (also depends on the chart settings).
Direction:
The direction of the price is indicated by the colour of the candlestick. If the price of the candle is closing above the opening price of the candle, then the price is moving upwards and the candle would be green (the colour of the candle depends on the chart settings).
If the candle is red, then the price closed below the open.


Range:
The difference between the highest and lowest price of a candle is its range. You can calculate this by taking the price at the top of the upper wick and subtracting it from the price at the bottom of the lower wick. (Range = highest point – lowest point).
The Wick:
The next important element of a candlestick is the wick, which is also referred to as a ‘shadow’. These points are vital as they show the extremes in the price for a specific charting period. The wicks are quickly identifiable as they are visually thinner than the body of the candlestick.
This is where the strength of candlesticks becomes apparent. Candlesticks can help traders keep their eye on market momentum and away from the static of price extremes.
Why Candlestick Wicks Are Important
The wicks of candlesticks along with the body tell a story. A wick which can be called a shadow or tail of a candlestick is a line situated above and below the body of the candlestick.

Candlestick wicks are formed due to a change in market sentiment.
The upper wick is formed when the price is moving up and then market perception is changed by traders and then the price is pushed down towards the open by sellers. The opposite is true for lower wicks
Candlestick wicks with long upper shadows commonly occur when an uptrend is losing strength.
Long lower shadows occur when the downtrend is losing steam.
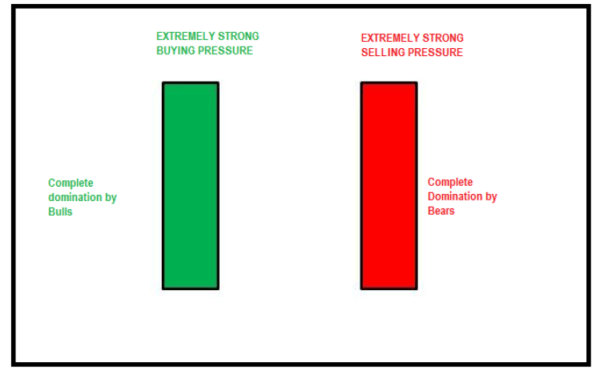
Candlestick Body Length
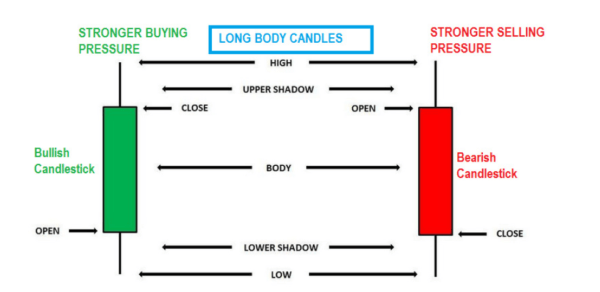
- The longer the body of a candle the stronger the buying or selling pressure.
- A short candlestick body indicates little price movement and therefore less buying or selling pressure.
- Sometimes the candles will have no upper or lower shadows but very long bodies. These are interpreted the same way as standard candlesticks but are an even stronger indication of bullish or negative market sentiment.
- In the case of a bullish candle, prices never decline below the open. In the case of a bearish candle, the price never trades above the open.
Bullish Vs Bearish Candlesticks
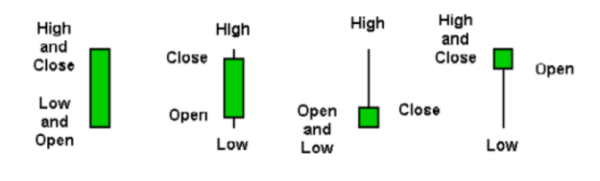
A Bullish candlestick means the price opened lower and closed up higher after a certain period, which can be 1 minute, 5minute, 1hr or 1 day etc.
All these candlesticks shown below are bullish candlesticks which means that their opening prices were lower than the closing prices and therefore reflect an overall uptrend in the timeframe each candlestick was formed:
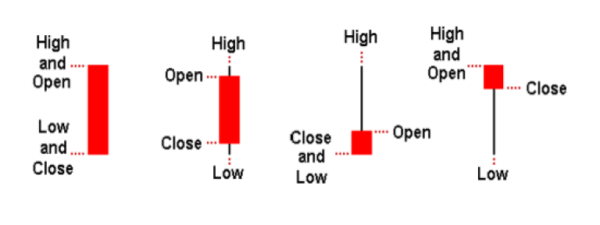
A bearish candlestick simply means that the candlestick opened up at a high price and closed lower after a certain period.
All these candlesticks shown below are bearish candlesticks meaning that the opening price was higher than the closing price, therefore reflecting a downtrend:
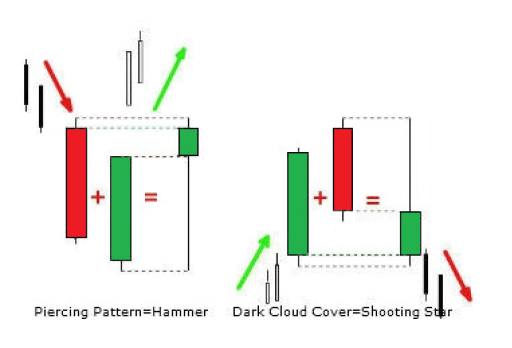
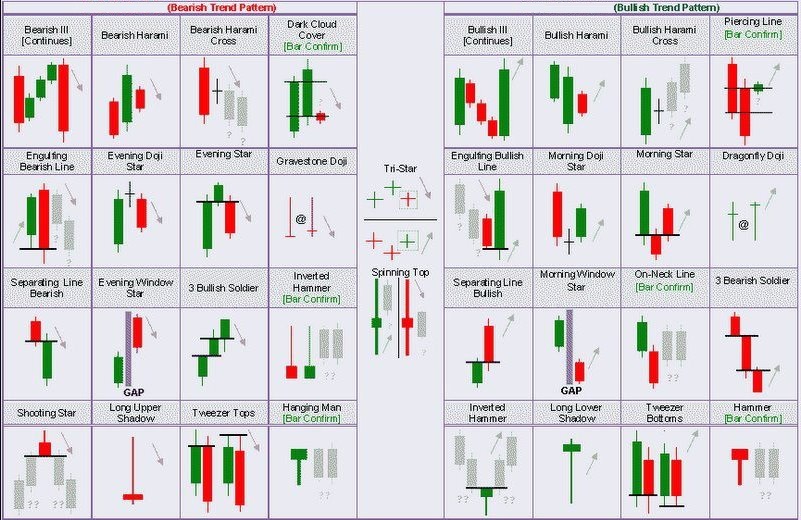
Interpreting Single Candlestick formations
Individual candlesticks can offer a lot of insight into current market sentiment. Candlesticks like the pin bars offer clues as to changing momentum and potentially where the market prices may reverse.
Interpreting Multiple Candlesticks formations
A group of candlesticks can show you how strong or weak a bullish or bearish move is and whether it's weakening or not (momentum).
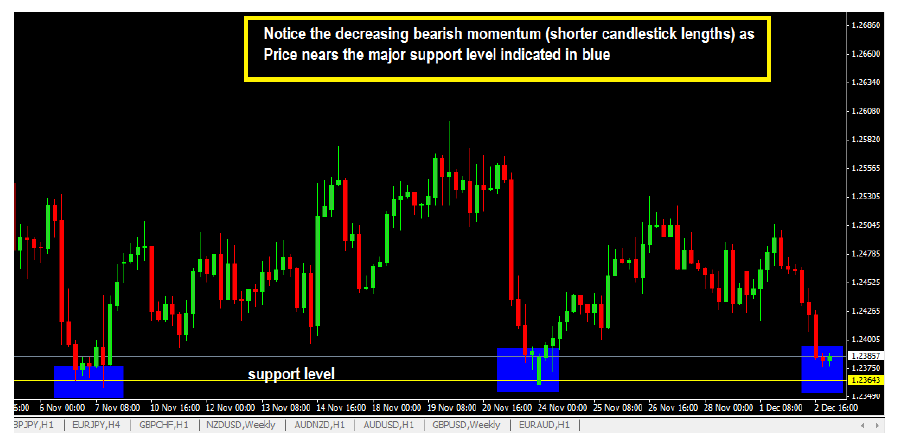
The chart below shows 3 bearish candlesticks in a downtrend, each with decreasing body length.
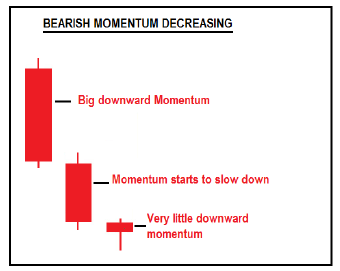
When you see candlesticks like this in a downtrend you should interpret it as a signal that the downtrend is weakening.
If this happens around support levels, you should watch for bullish reversal candlesticks which will give you opportunities to buy.
The following chart below shows you an example of decreasing downward momentum as the price nears a support level.
Notice how the prior candlesticks will tend to be longer and as the price nears the support level, the candlesticks start to get shorter:
A weakening bullish momentum will show the opposite characteristics and you should be on the lookout for selling opportunities. Once you get good at reading candlesticks you can spot these trading opportunities without using indicators.
Explore The Chapters In The Price Action Course
Share this using the buttons below
Other Posts You May Be Interested In
Revealed: How To Become A Deriv Payment Agent
This post will teach you how to become a Deriv payment agent easily and make [...]
What Is An Islamic Forex Account?
What Is An Islamic Forex Account? An Islamic, or ḥalāl forex trading account is a [...]
Profitable Chart Patterns Every Trader Needs To Know
There’s a difference between chart patterns and candlestick patterns. Chart patterns are not candlestick patterns and candlestick patterns are not chart patterns: Chart [...]
Bullish Engulfing Pattern Forex Trading Strategy
One important skill as a forex trader is the ability to spot reversal patterns when [...]
HFM Broker Review (2024) ☑️ Is It Trsutworthy?
HFM Overview HFM, previously known as Hotforex was founded in 2010 and has its headquarters [...]
How To Trade Confluence With Price Action
Confluence refers to a junction of two or more items. For example, the place where [...]